Problem set 2
advertisement
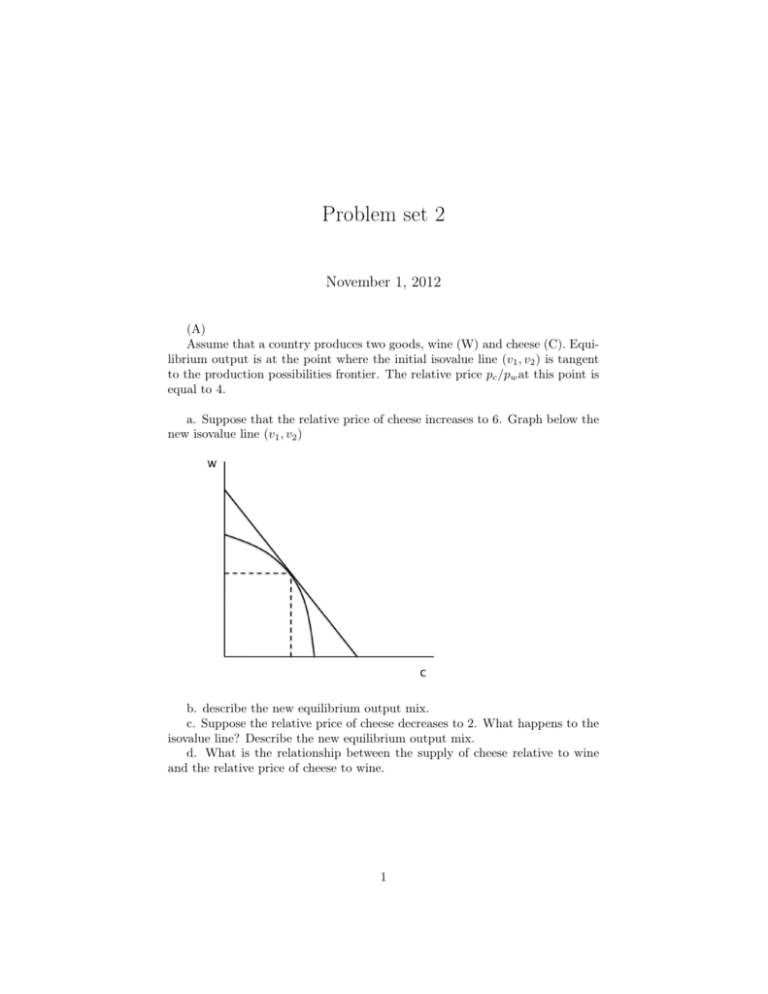
Problem set 2 November 1, 2012 (A) Assume that a country produces two goods, wine (W) and cheese (C). Equilibrium output is at the point where the initial isovalue line (v1 , v2 ) is tangent to the production possibilities frontier. The relative price pc /pw at this point is equal to 4. a. Suppose that the relative price of cheese increases to 6. Graph below the new isovalue line (v1 , v2 ) b. describe the new equilibrium output mix. c. Suppose the relative price of cheese decreases to 2. What happens to the isovalue line? Describe the new equilibrium output mix. d. What is the relationship between the supply of cheese relative to wine and the relative price of cheese to wine. 1 (B) In the same economy of problem (A) assume that the relative price of cheese to wine is 4 and that the economy exports wine and import cheese. a. Given these consumption preferences, describe the point at which the isovalue line is tangent to the highest indifference curve. Draw isoquants on the figure below to illustrate tangency. b. Assume the relative price of cheese rises to 6. What is the effect on production and consumption? c. What are the welfare effects of this relative price change? d. Discuss the income and substitution effects associated with this relative price change. e. Assume that the relative price of cheese falls to 2. Discuss the effect on production, consumption, the terms of trade and the welfare of the economy. C) In the same economy of previous problems, suppose instead that the economy export cheese and import wine. a. Use the tangency of the isovalue line, the production possibility frontier and the highest indifference curve to show the production and consumption points of this economy. b. What are the effects on production of a decline in the relative price of cheese? c. What are the effects on consumption of the decline in relative prices? Is this country better off or worse off? d. Discuss the relationship between a country’s term of trade and its welfare. 2 D) Suppose to have two economies EU and US that produce potato chips (P) and micro-chips (M). They produce with linear technologies, Constant Return to Scale (CRS) employing only the labour factor (L). Production cost in terms of labour for one box of P and one M are reported in the table below: US UE Potato chips 2 20 Micro-chips 8 10 In the two economies consumers buy P and M combining exactly 1 P with one M. In each market there is perfect competition and labour force is in UE 400 and in US 200. a. Graph the transformation curve in the two countries. Find in the graph the equilibrium for consumption and production in autarky in each country. Derive them also algebraically. b. Suppose that in the open economy terms of trade imply that 1 box of P is exchanged with 1 M. Show in a graph export and imports of the two countries. c. Suppose that technologies become the same in the two economies. In particular in the sector that produces P production function is with fixed coefficients, and 1 worker is needed to produce 1 box of P. In the production of Micro-chips, to start the production 200 workers are needed in order to build up the plant. Once the plant has been paid, each new worker produces 1 M, independently of the number of workers. Preferences are the same. Remember that in US L=200 and in EU L=400. Write the production functions of the two sectors, showing the return to scale of each function. d. Which of the two economies would be initially advantaged by the production of M? e. Draw the new transformation lines and indicate the equilibrium points in autarky in both economies. f. Show graphically what happens if the two economies are open to trade and international Terms of Trade (TT) is 1. Discuss if this TT can be an equilibrium. 3
