Fact Sheet
4Q 2015
Minimum Volatility Equity Strategy
Strategy Overview
STRATEGY AT-A-GLANCE 1
Inception Date
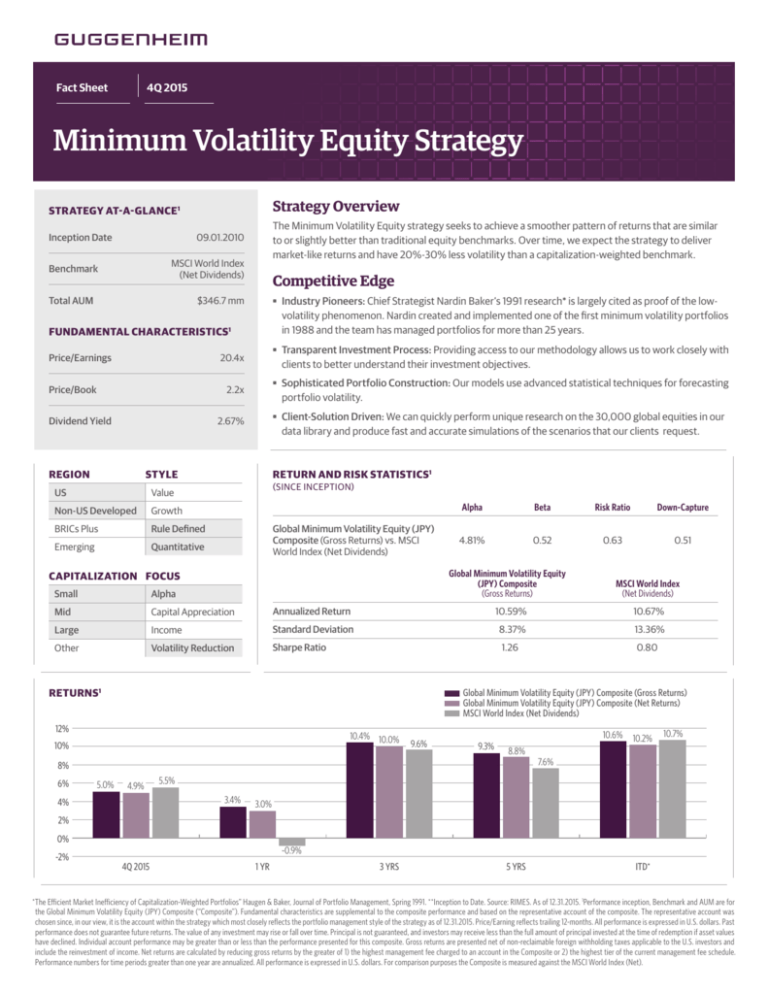
The Minimum Volatility Equity strategy seeks to achieve a smoother pattern of returns that are similar
to or slightly better than traditional equity benchmarks. Over time, we expect the strategy to deliver
market-like returns and have 20%-30% less volatility than a capitalization-weighted benchmark.
09.01.2010
MSCI World Index
(Net Dividends)
Benchmark
Total AUM
Competitive Edge
Industry Pioneers: Chief Strategist Nardin Baker’s 1991 research* is largely cited as proof of the lowvolatility phenomenon. Nardin created and implemented one of the first minimum volatility portfolios
in 1988 and the team has managed portfolios for more than 25 years.
$346.7 mm
FUNDAMENTAL CHARACTERISTICS1
Price/Earnings
Transparent Investment Process: Providing access to our methodology allows us to work closely with
clients to better understand their investment objectives.
20.4x
Price/Book
Dividend Yield
REGION
Sophisticated Portfolio Construction: Our models use advanced statistical techniques for forecasting
portfolio volatility.
2.2x
2.67%
Client-Solution Driven: We can quickly perform unique research on the 30,000 global equities in our
data library and produce fast and accurate simulations of the scenarios that our clients request.
RETURN AND RISK STATISTICS1
STYLE
US
Value
Non-US Developed
Growth
BRICs Plus
Rule Defined
Emerging
Quantitative
(SINCE INCEPTION)
Global Minimum Volatility Equity (JPY)
Composite (Gross Returns) vs. MSCI
World Index (Net Dividends)
Alpha
Beta
Risk Ratio
Down-Capture
4.81%
0.52
0.63
0.51
Global Minimum Volatility Equity
(JPY) Composite
(Gross Returns)
CAPITALIZATION FOCUS
MSCI World Index
(Net Dividends)
Small
Alpha
Mid
Capital Appreciation
Annualized Return
10.59%
10.67%
Large
Income
Standard Deviation
8.37%
13.36%
Other
Volatility Reduction
Sharpe Ratio
1.26
0.80
RETURNS1
Global Minimum Volatility Equity (JPY) Composite (Gross Returns)
Global Minimum Volatility Equity (JPY) Composite (Net Returns)
MSCI World Index (Net Dividends)
12%
10.4% 10.0%
10%
9.6%
10.6%
9.3%
8.8%
8%
6%
5.0%
4.9%
10.7%
7.6%
5.5%
3.4%
4%
10.2%
3.0%
2%
0%
-2%
-0.9%
4Q 2015
1 YR
3 YRS
5 YRS
ITD*
*The Efficient Market Inefficiency of Capitalization-Weighted Portfolios” Haugen & Baker, Journal of Portfolio Management, Spring 1991. **Inception to Date. Source: RIMES. As of 12.31.2015. 1Performance inception, Benchmark and AUM are for
the Global Minimum Volatility Equity (JPY) Composite (“Composite”). Fundamental characteristics are supplemental to the composite performance and based on the representative account of the composite. The representative account was
chosen since, in our view, it is the account within the strategy which most closely reflects the portfolio management style of the strategy as of 12.31.2015. Price/Earning reflects trailing 12-months. All performance is expressed in U.S. dollars. Past
performance does not guarantee future returns. The value of any investment may rise or fall over time. Principal is not guaranteed, and investors may receive less than the full amount of principal invested at the time of redemption if asset values
have declined. Individual account performance may be greater than or less than the performance presented for this composite. Gross returns are presented net of non-reclaimable foreign withholding taxes applicable to the U.S. investors and
include the reinvestment of income. Net returns are calculated by reducing gross returns by the greater of 1) the highest management fee charged to an account in the Composite or 2) the highest tier of the current management fee schedule.
Performance numbers for time periods greater than one year are annualized. All performance is expressed in U.S. dollars. For comparison purposes the Composite is measured against the MSCI World Index (Net).
Minimum Volatility Equity Strategy
4Q 2015
Guggenheim Investments
Guggenheim Investments is the global asset management and investment advisory division of
Guggenheim Partners, with $198 billion1 in assets across fixed income, equity and alternative
strategies. We focus on the return and risk needs of insurance companies, corporate and public
pension funds, sovereign wealth funds, endowments and foundations, wealth managers
and high net worth investors. Our 275+ investment professionals perform rigorous research
to understand market trends and identify undervalued opportunities in areas that are often
complex and underfollowed. This approach to investment management has enabled us to
deliver innovative strategies providing diversification and attractive long-term results.
Guggenheim Partners is a global investment and advisory firm with more than $240 billion2 in
assets under management. Across our three primary businesses of investment management,
investment banking and insurance services, we have a track record of delivering results through
innovative solutions. We have 2,500 professionals serving our clients from more than 25 offices
around the world. Our commitment is to advance the strategic interests of our clients and to
deliver long-term results with excellence and integrity.
page 2 | GPIM20925
NEW YORK
330 Madison Avenue | 10017
212 739 0700
CHICAGO
227 W Monroe Street | 60606
312 827 0100
SANTA MONICA
Guggenheim Partners
IMPORTANT INFORMATION AND DISCLOSURES
1
Guggenheim Investments total asset figure is as of 12.31.2015. The assets
include leverage of $12.0 bn for assets under management and $0.5 bn
for assets for which we provide administrative services. Guggenheim
Investments represents the following affiliated investment management
businesses: Guggenheim Partners Investment Management, LLC, Security
Investors, LLC, Guggenheim Funds Investment Advisors, LLC, Guggenheim
Funds Distributors, LLC, Guggenheim Real Estate, LLC, Transparent Value
Advisors, LLC, GS GAMMA Advisors, LLC, Guggenheim Partners Europe
Limited and Guggenheim Partners India Management.
2
Assets under management are as of 12.31.2015 and include consulting
services for clients whose assets are valued at approximately $47 bn.
The information presented herein has been prepared for informational
purposes only and is not an offer to buy or sell, or a solicitation of an offer to
buy or sell, any security or fund interest. Guggenheim Partners Investment
Management, LLC (GPIM) serves as the investment adviser to the Minimum
Volatility Equity Strategy.
Guggenheim Investments Asset Management (GIAM) claims compliance
with the Global Investment Performance Standards (GIPS®). GIAM is a
global investment management firm providing fixed income, equity and
alternative investment services primarily to institutional investors and is
comprised of the following affiliated entities of Guggenheim Partners, LLC:
Guggenheim Partners Investment Management, LLC (GPIM), Guggenheim
Partners Europe Limited (GPE), Transparent Value Advisors, LLC (TVA), and,
as of February 2012, Security Investors, LLC (SI). To receive a full list of GIAM
compliant composite descriptions and/or a GIPS compliant presentation,
please contact institutional@guggenheiminvestments.com.
The Global Minimum Volatility Equity (JPY) Composite is comprised of
accounts that invest in global equities with the objective of achieving
lower volatility than the chosen benchmark. A feature of the security
selection process for the accounts in this composite is that the portfolios
are optimized in Japanese yen. Country and sector selection are maintained
relatively close to the benchmark.
No representation or warranty is made by Guggenheim Investments or
any of their related entities or affiliates as to the sufficiency, relevance,
importance, appropriateness, completeness, or comprehensiveness of the
market data, information or summaries contained herein for any specific
purpose. The views expressed in this presentation are subject to change
based on market and other conditions. The opinions expressed may differ
from those of other entities affiliated with Guggenheim Investments that
use different investment philosophies. All material has been obtained from
sources believed to be reliable, but its accuracy is not guaranteed.
No assurance can be given that the investment objectives described herein
will be achieved and investment results may vary substantially on a quarterly,
annual or other periodic basis. The views and strategies described herein
may not be suitable for all investors. All investments have inherent risks.
Stock markets can be volatile. Investments in securities of small and
medium capitalization companies may involve greater risk of loss and more
abrupt fluctuations in market price than investments in larger companies.
Investments in foreign instruments may be volatile due to the impact of
diplomatic, political or economic developments on the country in question,
which may be magnified in emerging markets. The strategies discussed
herein may include the use of derivatives. Derivatives often involve a high
degree of financial risk because a relatively small movement in the price of
the underlying security or benchmark may result in a disproportionately
large movement, unfavorable or favorable in the price of the derivative
Contact Us
instrument.
The referenced indices are unmanaged and not available for direct
investment. Index performance does not reflect transaction costs, fees or
expenses.
The MSCI World Index (Net) is calculated with net dividends reinvested.
It is an unmanaged free float-adjusted market capitalization index that is
designed to measure global developed market equity performance. As
of 12.31.2015, the MSCI World Index (Net) captured large and mid cap
representation across 23 Developed Markets.
Whilst this document may be issued outside the United Kingdom directly by
Guggenheim Partners Investment Management, LLC, which is responsible
for its contents, wherever issued, it is being issued inside and outside the
United Kingdom by Guggenheim Investment Advisors (Europe) Limited
(which is authorized and regulated by the Financial Conduct Authority
(“FCA”) only to and/or is directed only at persons who are professional
clients or eligible counterparties for the purposes of the FCA’s Conduct of
Business Sourcebook.
Applicable to Middle East Investors: Contents of this report prepared by
Guggenheim Partners Investment Management, LLC, Transparent Value
Advisors, LLC and Guggenheim Partners Europe Limited, all registered
entities in their respective jurisdictions, and affiliates of Guggenheim KBBO
Partners Limited, the Authorized Firm regulated by the Dubai Financial
Services Authority. This report is intended for qualified investor use only
as defined in the DFSA Conduct of Business Module.
© 2016 Guggenheim Partners, LLC. All Rights Reserved. No part of this
document may be reproduced, stored, or transmitted by any means without
the express written consent of Guggenheim Partners, LLC. 100 Wilshire Boulevard | 90401
310 576 1270
LONDON
5 Wilton Road | SWIV 1AN
+44 203 059 6621
Key Investment
Professionals
Scott Minerd
Managing Partner
Chairman of Investments and
Global Chief Investment Officer
Farhan Sharaff
Senior Managing Director
Assistant Chief Investment Officer
Nardin Baker, CFA
Chief Strategist
Head of Research
Scott Hammond
Managing Director
Portfolio Manager
Ole Jakob Wold
Managing Director
Portfolio Manager
Evan Einstein
Vice President
guggenheiminvestments.com/institutional


![Your_Solutions_LLC_-_New_Business3[1]](http://s2.studylib.net/store/data/005544494_1-444a738d95c4d66d28ef7ef4e25c86f0-300x300.png)

