Taxation Costs: Solutions & Applications
advertisement
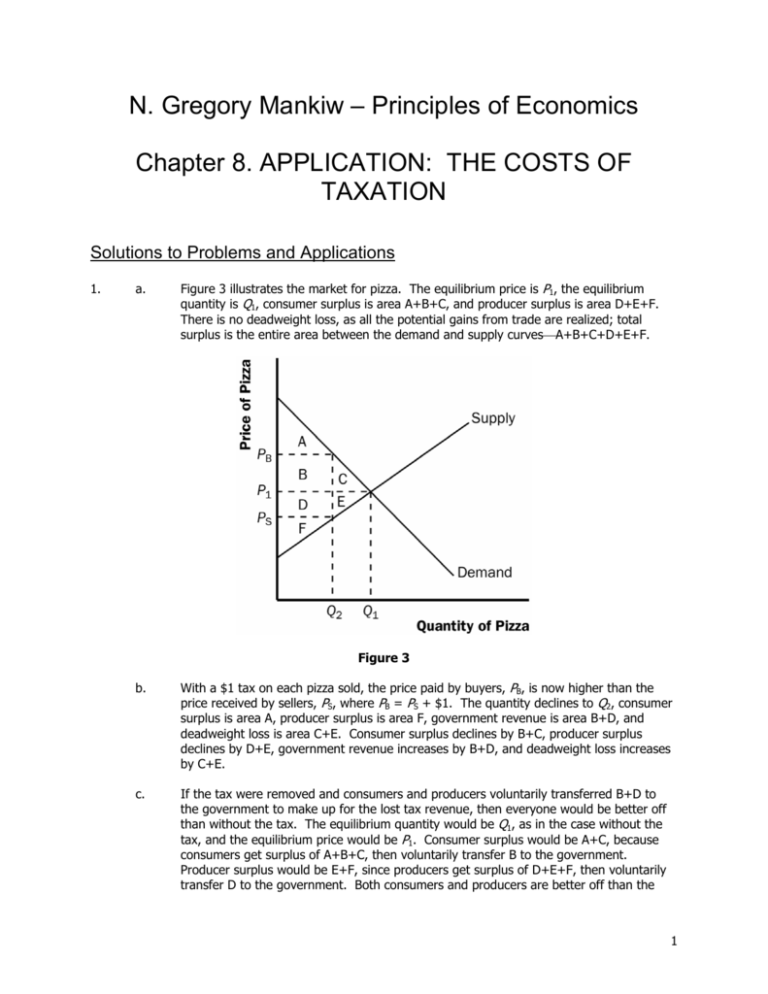
N. Gregory Mankiw – Principles of Economics Chapter 8. APPLICATION: THE COSTS OF TAXATION Solutions to Problems and Applications 1. a. Figure 3 illustrates the market for pizza. The equilibrium price is P1, the equilibrium quantity is Q1, consumer surplus is area A+B+C, and producer surplus is area D+E+F. There is no deadweight loss, as all the potential gains from trade are realized; total surplus is the entire area between the demand and supply curves⎯A+B+C+D+E+F. Figure 3 b. With a $1 tax on each pizza sold, the price paid by buyers, PB, is now higher than the price received by sellers, PS, where PB = PS + $1. The quantity declines to Q2, consumer surplus is area A, producer surplus is area F, government revenue is area B+D, and deadweight loss is area C+E. Consumer surplus declines by B+C, producer surplus declines by D+E, government revenue increases by B+D, and deadweight loss increases by C+E. c. If the tax were removed and consumers and producers voluntarily transferred B+D to the government to make up for the lost tax revenue, then everyone would be better off than without the tax. The equilibrium quantity would be Q1, as in the case without the tax, and the equilibrium price would be P1. Consumer surplus would be A+C, because consumers get surplus of A+B+C, then voluntarily transfer B to the government. Producer surplus would be E+F, since producers get surplus of D+E+F, then voluntarily transfer D to the government. Both consumers and producers are better off than the 1 Chapter 8 case when the tax was imposed. If consumers and producers gave a little bit more than B+D to the government, then all three parties, including the government, would be better off. This illustrates the inefficiency of taxation. 2. 3. 4. a. The statement, "If the government taxes land, wealthy landowners will pass the tax on to their poorer renters," is incorrect. With a tax on land, landowners can not pass the tax on. Since the supply curve of land is perfectly inelastic, landowners bear the entire burden of the tax. Renters will not be affected at all. b. The statement, "If the government taxes apartment buildings, wealthy landowners will pass the tax on to their poorer renters," is partially correct. With a tax on apartment buildings, landowners can pass the tax on more easily, though the extent to which they do this depends on the elasticities of supply and demand. In this case, the tax is a direct addition to the cost of rental units, so the supply curve will shift up by the amount of the tax. The tax will be shared by renters and landowners, depending on the elasticities of demand and supply. a. The statement, "A tax that has no deadweight loss cannot raise any revenue for the government," is incorrect. An example is the case of a tax when either supply or demand is perfectly inelastic. The tax has neither an effect on quantity nor any deadweight loss, but it does raise revenue. b. The statement, "A tax that raises no revenue for the government cannot have any deadweight loss," is incorrect. An example is the case of a 100 percent tax imposed on sellers. With a 100 percent tax on their sales of the good, sellers won't supply any of the good, so the tax will raise no revenue. Yet the tax has a large deadweight loss, since it reduces the quantity sold to zero. a. With very elastic supply and very inelastic demand, the burden of the tax on rubber bands will be borne largely by buyers. As Figure 4 shows, consumer surplus declines considerably, by area A+B, but producer surplus doesn't fall much at all, just by area C+D. Chapter 8 Figure 4 b. With very inelastic supply and very elastic demand, the burden of the tax on rubber bands will be borne largely by sellers. As Figure 5 shows, consumer surplus does not decline much, just by area A+B, while producer surplus falls substantially, by area C+D. Compared to part (a), producers bear much more of the burden of the tax, and consumers bear much less. Figure 5 5. a. The deadweight loss from a tax on heating oil is likely to be greater in the fifth year after it is imposed rather than the first year. In the first year, the elasticity of demand is fairly low, as people who own oil heaters are not likely to get rid of them right away. But over time they may switch to other energy sources and people buying new heaters for their homes will more likely choose gas or electric, so the tax will have a greater impact on quantity. b. The tax revenue is likely to be higher in the first year after it is imposed than in the fifth year. In the first year, demand is more inelastic, so the quantity does not decline as much and tax revenue is relatively high. As time passes and more people substitute away from oil, the equilibrium quantity declines, as does tax revenue. 6. Since the demand for food is inelastic, a tax on food is a good way to raise revenue because it does not lead to much of a deadweight loss; thus taxing food is less inefficient than taxing other things. But it is not a good way to raise revenue from an equity point of view, since poorer people spend a higher proportion of their income on food, so the tax would hit them harder than it would hit wealthier people. 7. a. This tax has such a high rate that it is not likely to raise much revenue. Because of the high tax rate, the equilibrium quantity in the market is likely to be at or near zero. b. Senator Moynihan's goal was probably to ban the use of hollow-tipped bullets. In this case, a tax is as effective as an outright ban. a. Figure 6 illustrates the market for socks and the effects of the tax. Without a tax, the equilibrium quantity would be Q1, the equilibrium price would be P1, total spending by 8. Chapter 8 consumers equals total revenue for producers, which is P1 x Q1, which equals area B+C+D+E+F, and government revenue is zero. The imposition of a tax places a wedge between the price buyers pay, PB, and the price sellers receive, PS, where PB = PS + tax. The quantity sold declines to Q2. Now total spending by consumers is PB x Q2, which equals area A+B+C+D, total revenue for producers is PS x Q2, which is area C+D, and government tax revenue is Q2 x tax, which is area A+B. b. Unless supply is perfectly elastic, the price received by producers falls because of the tax. Total receipts for producers fall, since producers lose revenue equal to area B+E+F. Figure 6 c. The price paid by consumers rises, unless demand is perfectly elastic. Whether total spending by consumers rises or falls depends on the price elasticity of demand. If demand is elastic, the percentage decline in quantity exceeds the percentage increase in price, so total spending declines. If demand is inelastic, the percentage decline in quantity is less than the percentage increase in price, so total spending rises. Whether total consumer spending falls or rises, consumer surplus declines because of the increase in price and reduction in quantity. 9. Since the tax on gadgets was eliminated, all tax revenue must come from the tax on widgets. The tax revenue from the tax on widgets equals the tax per unit times the quantity produced. Assuming that neither the supply nor the demand curves for widgets are perfectly elastic or inelastic and since the increased tax causes a smaller quantity of widgets to be produced, then it is impossible for tax revenue to double--multiplying the tax per unit (which doubles) times the quantity (which declines) gives a number that is less than double the original tax revenue from widgets. So the government's tax change will yield less money than before. 10. a. Figure 7 illustrates the effects of the tax increase on the new car market in New Jersey. The quantity of cars sold declines from Q1 to Q2, the price paid by consumers rises from PB1 to PB2, and the price received by producers declines from PS1 to PS2, where PB1 = PS1 + $100 and PB2 = PS2 + $150. Chapter 8 Figure 7 b. The following table shows the welfare impact of the change in the tax. Consumer Surplus Producer Surplus Government Revenue Total Surplus OLD A+B+C F+G+H D+E A+B+C+D+E+F+G+H NEW A H B+D+F A+B+D+F+H CHANGE –(B+C) –(F+G) +(B+F)–E –(C+E+G) c. The change in government revenue is B + F – E, which could be positive or negative. d. The change in deadweight loss is positive, as it increases by C+E+G, meaning that the economy as a whole is worse off. e. The demand for cars in New Jersey is probably fairly elastic, since people could travel to nearby states to buy cars. With elastic demand, area B in the figure will be very small, so the additional tax is less likely to increase government revenue. New Jersey could try to reduce the elasticity of demand by requiring people to pay sales tax to New Jersey when they buy a car outside the state. 11. From the standpoint of economic efficiency, the British poll tax is wonderful, because it does not distort any economic incentives, so it has no deadweight loss. But such a tax is inequitable, because it is more burdensome on the poor than on the rich. As a result, the tax was quite unpopular. 12. Figure 8 illustrates the effects of the $2 subsidy on a good. Without the subsidy, the equilibrium price is P1 and the equilibrium quantity is Q1. With the subsidy, buyers pay price PB, producers receive price PS (where PS = PB + $2), and the quantity sold is Q2. The following table illustrates the effect of the subsidy on consumer surplus, producer surplus, government revenue, and total surplus. Since total surplus declines by area D+H, the subsidy leads to a deadweight loss in that amount. Consumer Surplus Producer Surplus Government Revenue Total Surplus OLD A+B E+I 0 A+B+E+I NEW A+B+E+F+G B+C+E+I –(B+C+D+E+F+G+H) A+B–D+E–H+I CHANGE +(E+F+G) +(B+C) –(B+C+D+E+F+G+H) -(D+H) Chapter 8 13. a. Figure 8 Setting quantity supplied equal to quantity demanded gives 2P = 300 – P. Adding P to both sides of the equation gives 3P = 300. Dividing both sides by 3 gives P = 100. Plugging P = 100 back into either equation for quantity demanded or supplied gives Q = 200. b. Now P is the price received by sellers and P+T is the price paid by buyers. Equating quantity demanded to quantity supplied gives 2P = 300 - (P+T). Adding P to both sides of the equation gives 3P = 300 – T. Dividing both sides by 3 gives P = 100 - T/3. This is the price received by sellers. The buyers pay a price equal to the price received by sellers plus the tax (P+T = 100 + 2T/3). The quantity sold is now Q = 2P = 200 – 2T/3. c. Since tax revenue is equal to T x Q and Q = 200 - 2T/3, tax revenue equals 200T - 2T2/3. Figure 9 shows a graph of this relationship. Tax revenue is zero at T = 0 and at T = 300. Figure 9 Chapter 8 d. As Figure 10 shows, the area of the triangle (laid on its side) that represents the deadweight loss is 1/2 x base x height, where the base is the change in the price, which is the size of the tax (T) and the height is the amount of the decline in quantity (2T/3). So the deadweight loss equals 1/2 x T x 2T/3 = T2/3. This rises exponentially from 0 (when T = 0) to 45,000 when T = 300, as shown in Figure 11. Figure 10 e. Figure 11 A tax of $200 per unit is a bad idea, because it's in a region in which tax revenue is declining. The government could reduce the tax to $150 per unit, get more tax revenue ($15,000 when the tax is $150 versus $13,333 when the tax is $200), and reduce the deadweight loss (7,500 when the tax is $150 compared to 13,333 when the tax is $200).

