Premaster Statistics Tutorial 2 – Exercises
advertisement
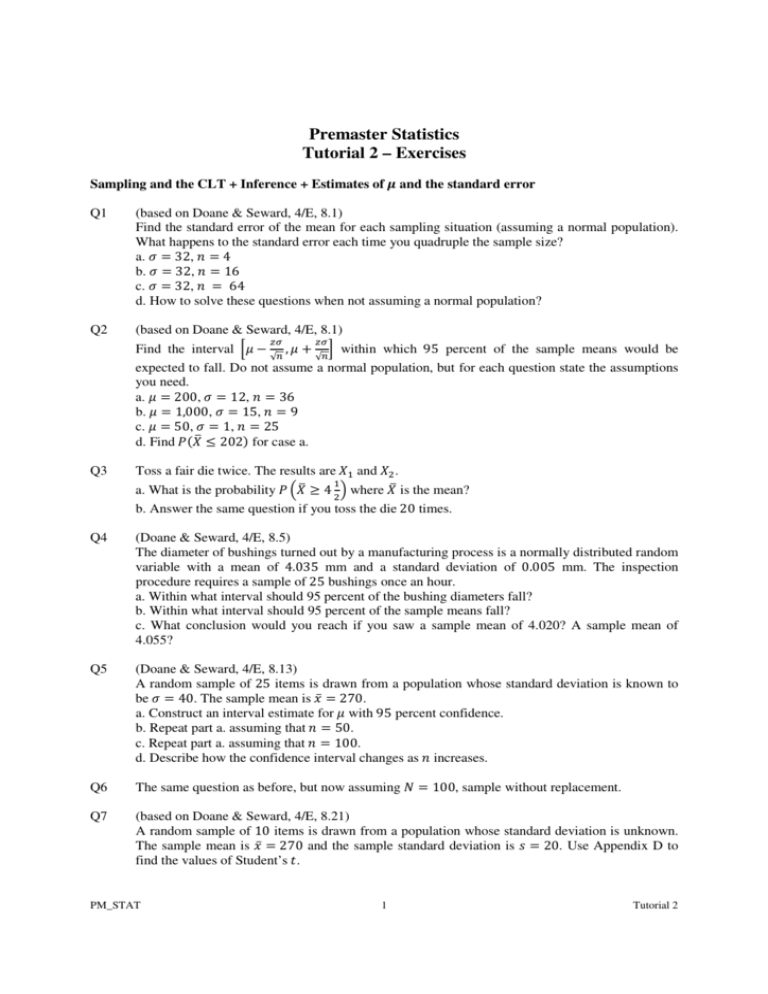
Premaster Statistics Tutorial 2 – Exercises Sampling and the CLT + Inference + Estimates of and the standard error Q1 (based on Doane & Seward, 4/E, 8.1) Find the standard error of the mean for each sampling situation (assuming a normal population). What happens to the standard error each time you quadruple the sample size? a. = 32, = 4 b. = 32, = 16 c. = 32, = 64 d. How to solve these questions when not assuming a normal population? Q2 (based on Doane & Seward, 4/E, 8.1) Find the interval − , + within which 95 percent of the sample means would be √ √ expected to fall. Do not assume a normal population, but for each question state the assumptions you need. a. = 200, = 12, = 36 b. = 1,000, = 15, = 9 c. = 50, = 1, = 25 d. Find ≤ 202 for case a. Q3 Toss a fair die twice. The results are and . a. What is the probability ≥ 4 " where is the mean? b. Answer the same question if you toss the die 20 times. Q4 (Doane & Seward, 4/E, 8.5) The diameter of bushings turned out by a manufacturing process is a normally distributed random variable with a mean of 4.035 mm and a standard deviation of 0.005 mm. The inspection procedure requires a sample of 25 bushings once an hour. a. Within what interval should 95 percent of the bushing diameters fall? b. Within what interval should 95 percent of the sample means fall? c. What conclusion would you reach if you saw a sample mean of 4.020? A sample mean of 4.055? Q5 (Doane & Seward, 4/E, 8.13) A random sample of 25 items is drawn from a population whose standard deviation is known to be = 40. The sample mean is $̅ = 270. a. Construct an interval estimate for with 95 percent confidence. b. Repeat part a. assuming that = 50. c. Repeat part a. assuming that = 100. d. Describe how the confidence interval changes as increases. Q6 The same question as before, but now assuming ' = 100, sample without replacement. Q7 (based on Doane & Seward, 4/E, 8.21) A random sample of 10 items is drawn from a population whose standard deviation is unknown. The sample mean is $̅ = 270 and the sample standard deviation is ( = 20. Use Appendix D to find the values of Student’s ). PM_STAT 1 Tutorial 2 a. Construct an interval estimate for with 95 percent confidence. State the assumptions you need. b. Repeat part a. assuming that = 20. c. Repeat part a. assuming that = 40. d. Describe how the confidence interval changes as increases. Q8 The same question as before, but now assume finite population of size ' = 100, sample without replacement. Also state the assumptions you need! Q9 (Doane & Seward, 4/E, 8.25) A random sample of monthly rent paid by 12 college seniors living off campus gave the results below (in dollars). Find a 99 percent confidence interval for µ, assuming that the sample is from a normal population. 900 810 770 860 850 790 810 800 890 720 910 640 Tests for and * Q1 (Doane & Seward, 4/E, 9.21) Procyon Mfg. produces tennis balls. Weights are supposed to be normally distributed with a mean of 2.035 ounces and a standard deviation of 0.002 ounces. A sample of 25 tennis balls shows a mean weight of 2.036 ounces. At + = .025 in a right-tailed test, is the mean weight heavier than it is supposed to be? Q2 (based on Doane & Seward, 4/E, 9.29) Find the critical value of Student’s ) for each hypothesis test on . a. 10 percent level of significance, two-tailed test, = 21 b. 1 percent level of significance, right-tailed test, = 9 c. 5 percent level of significance, left-tailed test, = 28 Q3 (Doane & Seward, 4/E, 9.43) At Oxnard University, a sample of 18 senior accounting majors showed a mean cumulative GPA of 3.35 with a standard deviation of 0.25. a. At + = .05 in a two-tailed test, does this differ significantly from 3.25 (the mean GPA for all business school seniors at the university)? b. Use the sample to construct a 95 percent confidence interval for the mean. Does the confidence interval include 3.25? c. Explain how the hypothesis test and confidence interval lead to the same conclusion. Q4 (Doane & Seward, 4/E, 9.44) Interpret each --value in your own words: a. --value =.387, ./ :1 ≥ .20, . :1 < .20, + = .10 b. --value =.043, ./ :1 ≤ .90, . :1 > .90, + = .05 c. --value =.0012, ./ :1 = .50, . :1 ≠ .50, + = .01 Q5 Suppose that in a hypothesis test about (known ) you compute the value of the standardized statistic 5 as +2.00. a. What is the --value if ./ : = / against . : ≠ / ? b. Can you compute the sample mean $̅ ? c. What is the p-value if ./ : ≤ / against . : > / ? PM_STAT 2 Tutorial 2 d. What is the --value if ./ : ≥ / against . : < / ? Q6 Suppose that in a hypothesis test about (known ) the --value is 0.08. a. Can you guess the calculated 6-value if ./ : = / against . : ≠ / ? b. Can you guess the calculated 6-value if ./ : ≤ / against . : > / ? c. Can you guess the calculated 6-value if ./ : ≥ / against . : < / ? Q7 (Doane & Seward, 4/E, 9.45) Calculate the test statistic and --value for each sample. a. ./ :1 = .20 versus . :1 ≠ .20, + = .025, - = .28, = 100 b. ./ :1 ≤ .50 versus . :1 > .50, + = .025, - = .60, = 90 c. ./ :1 ≤ .75 versus . :1 > .75, + = .10, - = .82, = 50 Note: use te continuity correction. Q8 (Doane & Seward, 4/E, 9.51) To encourage telephone efficiency, a catalog call center issues a guideline that at least half of all telephone orders should be completed within 2 minutes. Subsequently, a random sample of 64 telephone calls showed that only 24 calls lasted 2 minutes or less. a. At + = .05 is this a significant departure from the guideline in a left-tailed test? State your hypotheses and decision rule. b. Find the --value. c. Is the difference important (as opposed to significant)? Q9 (based on Doane & Seward, 4/E, 9.54) A coin was flipped 12 times and came up heads 10 times. a. Is the sample statistic approximately normally distributed? Explain. b. Calculate a --value for the observed sample outcome, using the normal distribution. At the . 05 level of significance in a right-tailed test, is the coin biased toward heads? c. Calculate the binomial probability ≥ 10| = 12, 1 = .50 = 1 − ≤ 9| = 12, 1 = .50. d. Why is the binomial probability not exactly the same as the --value you calculated under the assumption of normality? Q10 (based on Doane & Seward, 4/E, 9.55) BriteScreen, a manufacturer of 19-inch LCD computer screens, requires that on average 99.9 percent of all LCDs conform to its quality standard. In a day’s production of 2,000 units, 4 are defective. a. Assuming this is a random sample, is the standard being met, using the 10 percent level of significance? Hint: Use MegaStat or Excel to find the binomial probability ≥ 4| = 2000, 1 = .001 = 1 − ≤ 3| = 2000, 1 = .001. b. Show that normality for the test statistic should not be concluded. PM_STAT 3 Tutorial 2


