Programming Tools: Detailed Explanation
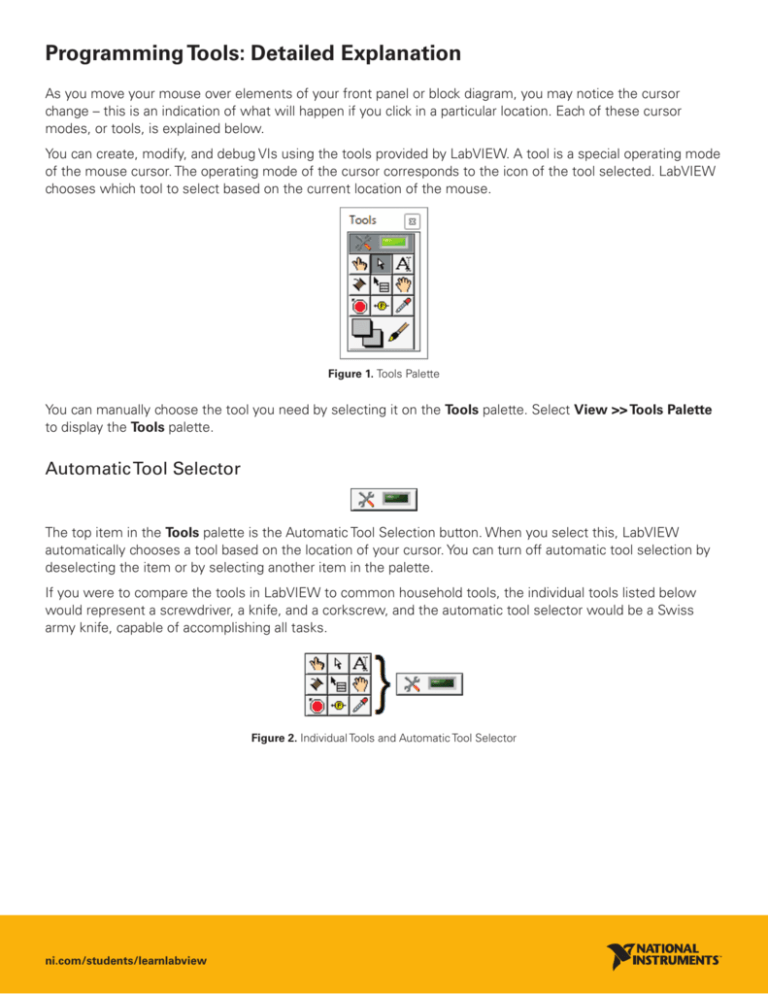
As you move your mouse over elements of your front panel or block diagram, you may notice the cursor
change – this is an indication of what will happen if you click in a particular location. Each of these cursor
modes, or tools, is explained below.
You can create, modify, and debug VIs using the tools provided by LabVIEW. A tool is a special operating mode
of the mouse cursor. The operating mode of the cursor corresponds to the icon of the tool selected. LabVIEW
chooses which tool to select based on the current location of the mouse.
Figure 1. Tools Palette
You can manually choose the tool you need by selecting it on the Tools palette. Select View >> Tools Palette
to display the Tools palette.
Automatic Tool Selector
The top item in the Tools palette is the Automatic Tool Selection button. When you select this, LabVIEW
automatically chooses a tool based on the location of your cursor. You can turn off automatic tool selection by
deselecting the item or by selecting another item in the palette.
If you were to compare the tools in LabVIEW to common household tools, the individual tools listed below
would represent a screwdriver, a knife, and a corkscrew, and the automatic tool selector would be a Swiss
army knife, capable of accomplishing all tasks.
Figure 2. Individual Tools and Automatic Tool Selector
ni.com/students/learnlabview
Common Tools in LabVIEW
Listed below are some of the more common tools that you encounter in LabVIEW. Note that when the
Automatic Tool Selection button is enabled, the mouse changes into one of the following tools to accomplish
the most common tasks in LabVIEW.
Operating Tool
When the mouse cursor changes to the icon shown above, the Operating tool is in operation. Use the
Operating tool to change the values of a control. For example, in Figure 2, the Operating tool moves the
pointer on the Horizontal Pointer Slide. When the mouse hovers over the pointer, the cursor automatically
accesses the Operating tool.
Figure 3. Using the Operating Tool
The Operating tool is mostly used on the front panel window, but you also can use the Operating tool on the
block diagram window to change the value of a Boolean constant.
ni.com/students/learnlabview
Positioning Tool
When the mouse cursor changes to the icon shown above, the Positioning tool is in operation. Use the
Positioning tool to select or resize objects. For example, in Figure 3, the Positioning tool selects the Number
of Measurements numeric control. After selecting an object, you can move, copy, or delete the object. When
the mouse hovers over the edge of an object, the cursor automatically accesses the Positioning tool.
Figure 4. Using the Positioning Tool to Select an Object
If the mouse hovers over a resizing node of an object, the cursor mode changes to show that you can resize
the object, as shown in Figure 4. Notice that the cursor is hovering over a corner of the XY graph at a resizing
node, and the cursor mode changes to a double-sided arrow. You can use the Positioning tool on both the front
panel window and the block diagram.
Figure 5. Using the Positioning Tool to Resize an Object
ni.com/students/learnlabview
Labeling Tool
When the mouse cursor changes to the icon shown above, the Labeling tool is in operation. Use the Labeling
tool to enter text in a control, to edit text, and to create free labels. For example, in Figure 5, the Labeling tool
enters text in the Number of Measurements numeric control. When the mouse hovers over the interior of
the control, the cursor automatically accesses the Labeling tool. Click once to place a cursor inside the control.
Then double-click to select the current text.
Figure 6. Using the Labeling Tool
When you are not in a specific area of a front panel window or block diagram window that accesses a certain
mouse mode, the cursor appears as crosshairs. If automatic tool selection is enabled, you can double-click any
open space to access the Labeling tool and create a free label.
ni.com/students/learnlabview
Wiring Tool
When the mouse cursor changes to the icon shown above, the Wiring tool is in operation. Use the Wiring tool
to wire objects together on the block diagram. For example, in Figure 6, the Wiring tool wires the Number of
Measurements terminal to the Loop Count terminal of the For Loop. When the mouse hovers over the exit or
entry point of a terminal or over a wire, the cursor automatically accesses the Wiring tool.
Figure 7. Using the Wiring Tool
The Wiring tool works mainly with the block diagram window and when you create a connector pane on the
front panel window.
ni.com/students/learnlabview
Other Tools Accessed From the Palette
You can access the Operating, Positioning, Labeling, and Wiring tools directly from the Tools palette, rather
than using the Automatic Tool Selection mode. Select View >> Tools Palette to access the Tools palette.
Figure 8. The Tools Palette
Use the Object Shortcut Menu tool to access an object shortcut menu with the left mouse button. You also
can access this menu by right-clicking any object in LabVIEW.
Use the Scrolling tool to scroll through windows without using scrollbars.
Use the Breakpoint tool to set breakpoints on VIs, functions, nodes, wires, and structures to pause execution
at that location.
Use the Probe tool to create probes on wires on the block diagram. Also use it to check intermediate values in
a VI that produces questionable or unexpected results.
Use the Coloring tool to color an object. The Coloring tool also displays the current foreground and background
color settings.
Use the Color Copy tool to copy colors for pasting with the Coloring tool.
ni.com/students/learnlabview
Shortcut Menus
All LabVIEW objects have associated shortcut menus, also known as context menus, pop-up menus, and rightclick menus. As you create a VI, use the shortcut menu items to change the appearance or behavior of front
panel and block diagram objects. To access the shortcut menu, right-click the object.
Figure 9. Shortcut Menu for a Meter
Property Dialog Boxes
Objects in the front panel window also have property dialog boxes that you can use to change the look or
behavior of the objects. Right-click an object and select Properties from the shortcut menu to access the
property dialog box for an object. Figure 9 shows the property dialog box for the meter shown in Figure 8. The
options on the property dialog box for an object are similar to the options on the shortcut menu for that object.
ni.com/students/learnlabview
Figure 10. Property Dialog Box for a Meter
You can select multiple objects on the front panel or the block diagram and edit any properties the objects
share. To select multiple objects, use the Positioning tool to drag a selection rectangle around all of the objects
you want to edit or hold down the <Shift> key while clicking each object. Right-click an object from the
selection and choose Properties from the shortcut menu to display the Properties dialog box. The Properties
dialog box only displays tabs and properties that the objects you select share. Select similar objects to display
more tabs and properties. If you select objects that do not share any common properties, the Properties
dialog box does not display any tabs or properties.
ni.com/students/learnlabview
Front Panel Window Toolbar
Each window has a toolbar associated with it. Use the front panel window toolbar buttons to run and edit the
VI. The following toolbar appears on the front panel window.
Click the Run button to run a VI. LabVIEW compiles the VI, if necessary. You can run a VI if the Run button
appears as a solid white arrow, shown above. The solid white arrow also indicates that you can use the VI as a
subVI if you create a connector pane for the VI.
While the VI runs, the Run button appears as shown above if the VI is a top-level VI, meaning it has no callers
and therefore is not a subVI.
If the VI that is running is a subVI, the Run button appears as shown above.
The Run button appears broken when the VI you are creating or editing contains errors. If the Run button still
appears broken after you finish wiring the block diagram, the VI is broken and cannot run. Click this button to
display the Error list window, which lists all errors and warnings.
Click the Run Continuously button to run the VI until you abort or pause execution. You also can click the
button again to disable continuous running.
While the VI runs, the Abort Execution button appears. Click this button to stop the VI immediately if there is
no other way to stop the VI. If more than one running top-level VI uses the VI, the button is dimmed.
Caution: The Abort Execution button stops the VI immediately, before the VI finishes the current iteration.
Aborting a VI that uses external resources, such as external hardware, might leave the resources in an
unknown state by not resetting or releasing them properly. Design VIs with a stop button to avoid this
problem.
Click the Pause button to pause a running VI. When you click the Pause button, LabVIEW highlights on the
block diagram the location where you paused execution, and the Pause button appears red. Click the Pause
button again to continue running the VI.
ni.com/students/learnlabview
Select the Text Settings pull-down menu to change the font settings for the selected portions of the VI,
including size, style, and color.
Select the Align Objects pull-down menu to align objects along axes, including vertical, top edge, left, and so
on.
Select the Distribute Objects pull-down menu to space objects evenly, including gaps, compression, and so
on.
Select the Resize Objects pull-down menu to resize multiple front panel objects to the same size.
Select the Reorder pull-down menu when you have objects that overlap each other and you want to define
which one is in front or back of another. Select one of the objects with the Positioning tool and then select
from Move Forward, Move Backward, Move To Front, and Move To Back.
Select the Show Context Help Window button to toggle the display of the Context Help window.
Enter Text appears to remind you that a new value is available to replace an old value. The Enter Text button
disappears when you click it, press the <Enter> key, or click the front panel or block diagram workspace.
Block Diagram Window Toolbar
Click the Clean Up Diagram button to automatically reroute all existing wires and rearrange objects on the
block diagram to generate a cleaner layout. To configure the clean up options, select Tools >> Options to
display the Options dialog box and select Block Diagram: Cleanup from the Category list.
The other buttons unique to the block diagram toolbar are primarily used for troubleshooting and are covered in
the Debugging Tools module.
©2011 National Instruments. All rights reserved. LabVIEW, National Instruments, NI, and ni.com are trademarks of National Instruments.
Other product and company names listed are trademarks or trade names of their respective companies.
ni.com/students/learnlabview
