HW6
advertisement
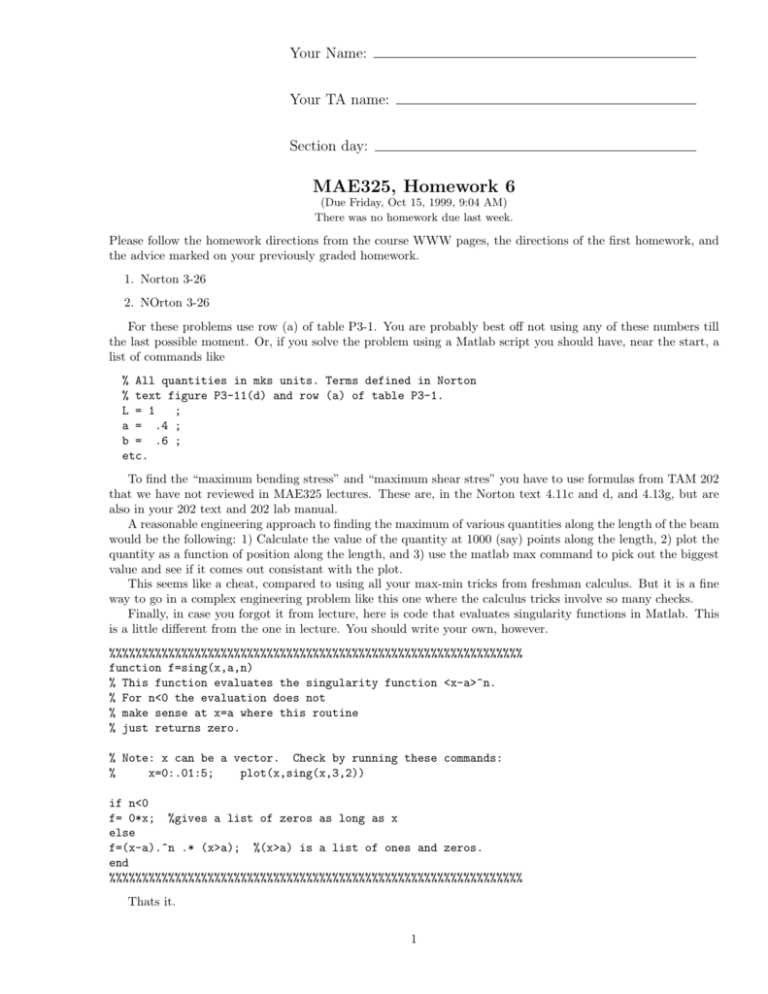
Your Name: Your TA name: Section day: MAE325, Homework 6 (Due Friday, Oct 15, 1999, 9:04 AM) There was no homework due last week. Please follow the homework directions from the course WWW pages, the directions of the first homework, and the advice marked on your previously graded homework. 1. Norton 3-26 2. NOrton 3-26 For these problems use row (a) of table P3-1. You are probably best off not using any of these numbers till the last possible moment. Or, if you solve the problem using a Matlab script you should have, near the start, a list of commands like % All quantities in mks units. Terms defined in Norton % text figure P3-11(d) and row (a) of table P3-1. L = 1 ; a = .4 ; b = .6 ; etc. To find the “maximum bending stress” and “maximum shear stres” you have to use formulas from TAM 202 that we have not reviewed in MAE325 lectures. These are, in the Norton text 4.11c and d, and 4.13g, but are also in your 202 text and 202 lab manual. A reasonable engineering approach to finding the maximum of various quantities along the length of the beam would be the following: 1) Calculate the value of the quantity at 1000 (say) points along the length, 2) plot the quantity as a function of position along the length, and 3) use the matlab max command to pick out the biggest value and see if it comes out consistant with the plot. This seems like a cheat, compared to using all your max-min tricks from freshman calculus. But it is a fine way to go in a complex engineering problem like this one where the calculus tricks involve so many checks. Finally, in case you forgot it from lecture, here is code that evaluates singularity functions in Matlab. This is a little different from the one in lecture. You should write your own, however. %%%%%%%%%%%%%%%%%%%%%%%%%%%%%%%%%%%%%%%%%%%%%%%%%%%%%%%%%%%%%%% function f=sing(x,a,n) % This function evaluates the singularity function <x-a>^n. % For n<0 the evaluation does not % make sense at x=a where this routine % just returns zero. % Note: x can be a vector. Check by running these commands: % x=0:.01:5; plot(x,sing(x,3,2)) if n<0 f= 0*x; %gives a list of zeros as long as x else f=(x-a).^n .* (x>a); %(x>a) is a list of ones and zeros. end %%%%%%%%%%%%%%%%%%%%%%%%%%%%%%%%%%%%%%%%%%%%%%%%%%%%%%%%%%%%%%% Thats it. 1
