Data Analysis BUS 304
advertisement
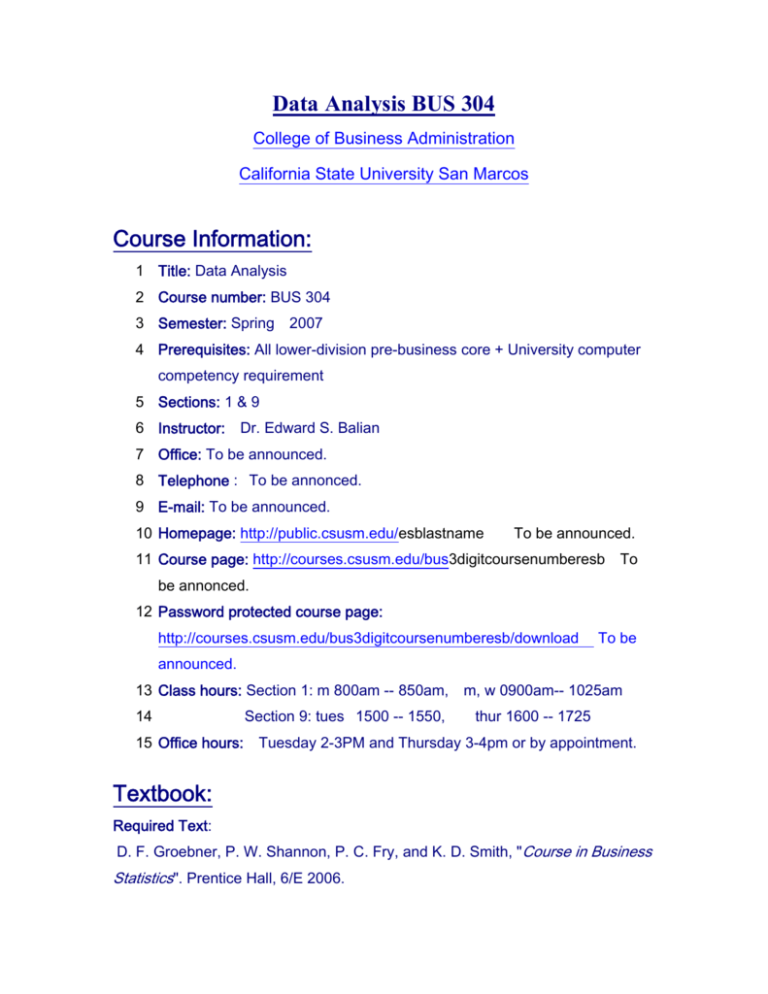
Data Analysis BUS 304 College of Business Administration California State University San Marcos Course Information: 1 Title: Data Analysis 2 Course number: BUS 304 3 Semester: Spring 2007 4 Prerequisites: All lower-division pre-business core + University computer competency requirement 5 Sections: 1 & 9 6 Instructor: Dr. Edward S. Balian 7 Office: To be announced. 8 Telephone : To be annonced. 9 E-mail: To be announced. 10 Homepage: http://public.csusm.edu/esblastname To be announced. 11 Course page: http://courses.csusm.edu/bus3digitcoursenumberesb To be annonced. 12 Password protected course page: http://courses.csusm.edu/bus3digitcoursenumberesb/download To be announced. 13 Class hours: Section 1: m 800am -- 850am, m, w 0900am-- 1025am 14 15 Office hours: Section 9: tues 1500 -- 1550, thur 1600 -- 1725 Tuesday 2-3PM and Thursday 3-4pm or by appointment. Textbook: Required Text: D. F. Groebner, P. W. Shannon, P. C. Fry, and K. D. Smith, "Course in Business Statistics". Prentice Hall, 6/E 2006. Other References: 1 D. F. Groebner, P. W. Shannon, P. C. Fry, and K. D. Smith, "Business Statistics: A Decision Making Approach". Prentice Hall, sixth edition 2005. 2 M. K. Pelosi and T. M. Sandifer, " Doing Statistics for Business with Excel", John Wiley & Sons, Inc. second edition 2002. 3 A. H. Kvanli, R. J. Pavur and K. B. Keeling, "Introduction to Business Statistics", South-Western, Edition 6, 2003. Course description and objectives: In order to stand out in today's competitive job market, new business school graduates need to bring to an organization special skills and abilities that give them the potential to hit the ground running and contribute immediately. One area where a student can have an immediate competitive advantage over both new graduates and existing employees is in the application of statistical analysis skills to business problems. Our intent in this course is to build your statistical back ground and to give you the statistical skills necessary to meet the needs of business and the real-world decision-making problems. In this course, we discuss real-world applications as a motivation for learning business statistics. We will focus on decision making and business applications and provide you with an understanding of the roll of business statistics in decision making. To enhance the students' appreciation for business statistics, we emphasize computer-based analysis, rather than manual computation. To this end, Microsoft Excel is used extensively throughout the course. Minitab may also be used as a supplement to Excel. Learning Outcomes: Following this course the students should 1 Know the data collection methods and understand how to categorize data. 2 Construct and interpret a scatter plot, joint frequency table, pareto chart, frequency histogram and various types of bar charts. 3 Compute and understand the mean, median, mode and variance for a set of data. 4 Compute the coefficient of variation and z scores and understand how they are applied in decision-making situations. 5 Be able to apply the common rules of probability and to identify the types of processes that are presented by discrete probability distributions. 6 Understand the main approaches to assessing probabilities and determine probabilities associated with binomial and poisson distributions. 7 Be able to discuss the important properties of the normal probability distribution and calculate probabilities using the normal distribution table and be able to apply the normal distribution in appropriate business situations. 8 Understand the concept of sampling error and the importance of the Central Limit Theorem. 9 Be able to determine the mean and standard deviation of the sampling distribution of the population mean and proportion. 10 Construct and interpret a confidence interval estimate for a single population mean using both the standard normal and t distribution. 11 Determine the required sample size for estimating a single population mean. 12 Establish and interpret a confidence interval estimate for a single population proportion. 13 Formulate null and alternative hypotheses for applications involving a single population mean, proportion, or variance. 14 Know how to use the test statistic, critical value, and p -value approach to test the null hypothesis. 15 Calculate and interpret the simple correlation between two variables. 16 Understand the basic assumptions behind single and multiple regression models. 17 Recognize some potential problems if regression analysis is used incorrectly. Course Requirements: Your course grade will be based on 4 exams, 4 homework assignments, a team project and class participation. Homework assignments: (15%) Team Project and group presentation: (15%) Exam 1: Chapters 1-3, Open book (10%) Exam 2: Chapters 4-5, Open book (10%) Exam 3: Chapters 6-8, Open book (10%) Final Exam: Chapters 1-8, 12, and 13 (cumulative), Closed book & Open book (30%) Class participation: (10%) Homework assignments: Homework assignments are designed to help you learn the mechanics of the methods discussed in class and to give you an opportunity to apply these concepts in a straightforward manner. In addition to their value as learning exercises, doing a careful and thorough job on the homework assignments is the best preparation for the examinations of the course. Homework policy: 1 There will be 4 assignments throughout the semester which will be posted. 2 You must submit a hard copy at the beginning of the class when it is due. 3 The first page of your report should be a cover page: your name, homework number, course number, date, etc. 4 Each problem must be answered in a separate page and in the same order as given. 5 All pages must be stapled together. 6 No late assignment will be accepted. Team Project and group presentation: The objective of this is to permit students to tailor the course to their own interests, whether they are in HTM, GBM, M&M, or Accounting/Finance. The project is designed to acquaint students with one specific area of application of statistics. Each team must submit a one-page proposal on December 1. Writing Requirement (as stated in the catalog): All CSU students must demonstrate competency in writing skills as a requirement for graduation. This requirement mandates that every course at the university must have a writing component of at least 2500 words (approximately 10 pages). To achieve this requirement in this course, each team is required to present their findings in the last week of class and hand in a final report. The general plan of the final report is as follows: 1 Executive Summary (1-2 pages): A clear summary of the project: issues raised by the managerial situation, your approach in resolving the situation and the final recommendations. 2 Main body (8-10 pages): A detailed analysis and explanation of the analytical approach followed by the students in solving the problem. 3 Conclusion (1-2 pages): A clear, concise summary of the recommendations for the specific actions to be taken targeted at the manager who may decide to implement these recommendations. Sample projects from previous years are available in my office. Grading Standards: 94-100 90 < 94 85 < 90 80 < 85 75 < 80 70 < 75 65 < 70 60 < 65 0 < 60 A A- B+ B B- C+ C C- F Tentative Course Schedule: Date Topics Notes Weeks 1,2, and 3 Chapters 1-3 Descriptive Statistics Histogram, charts and graphs Measure of central tendency and variation Coefficient of variation Standardized data values Assignment 1 due Chapters 1-3 Review Solution to Assignment 1 Weeks 4, 5, 6, and 7 Chapters 4 and 5 probability Probability rules Binomial distribution Exam 1 Normal distribution Assignment 2 due Chapters 4-5 Review Exam 2 Solution to Assignment 2 Weeks 8, 9, 10, & 11 Chapters 6-8 Sampling distributions Sampling distribution Confidence Intervals Sample size Hypothesis testing Chapters 6-8 Review Solution to Assignment 3 due Exam 3 Assignment 3 Weeks 12, 13, and 14 Chapters 12 and 13 Regression Analysis Simple linear regression Multiple linear regression Assignment 4 due Final review Week 15 Group presentation Final Exam Week 16 Section 1: May 14 7-9am Section 9: May 15 1:45pm3:45pm Project proposal due Academic Honesty Statement: Students will be expected to adhere to standards of academic honesty and integrity, as outlined in the Student Academic Honesty Policy. All written work and oral presentation assignments must be original work. All ideas/material that are borrowed from other sources must have appropriate references to the original sources. Any quoted material should give credit to the source and be punctuated with quotation marks. ADA statement: Students with disabilities who require reasonable accommodations must be approved for services by providing appropriate and recent documentations to the Office of Disabled Student Services (DSS). This office is located in Craven Hall 5205, and can be contacted by phone at (760) 750-4905, or TTY (760) 750-4909. Students authorized by DSS to receive reasonable accommodations should meet with me during my office hours in order to ensure confidentiality. NOTE: It is the student’s responsibility to understand and follow the University Policies as stated in the catalog.
