Effects of Osmosis on Living Tissue.doc - MrsGorukhomework
advertisement
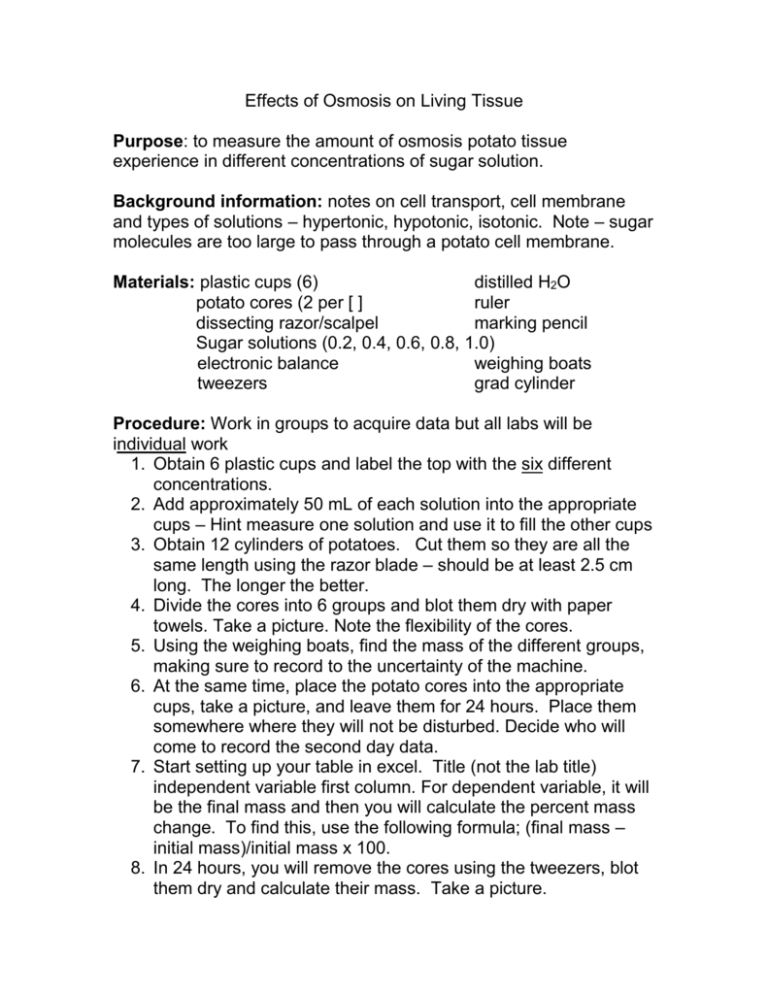
Effects of Osmosis on Living Tissue Purpose: to measure the amount of osmosis potato tissue experience in different concentrations of sugar solution. Background information: notes on cell transport, cell membrane and types of solutions – hypertonic, hypotonic, isotonic. Note – sugar molecules are too large to pass through a potato cell membrane. Materials: plastic cups (6) distilled H2O potato cores (2 per [ ] ruler dissecting razor/scalpel marking pencil Sugar solutions (0.2, 0.4, 0.6, 0.8, 1.0) electronic balance weighing boats tweezers grad cylinder Procedure: Work in groups to acquire data but all labs will be individual work 1. Obtain 6 plastic cups and label the top with the six different concentrations. 2. Add approximately 50 mL of each solution into the appropriate cups – Hint measure one solution and use it to fill the other cups 3. Obtain 12 cylinders of potatoes. Cut them so they are all the same length using the razor blade – should be at least 2.5 cm long. The longer the better. 4. Divide the cores into 6 groups and blot them dry with paper towels. Take a picture. Note the flexibility of the cores. 5. Using the weighing boats, find the mass of the different groups, making sure to record to the uncertainty of the machine. 6. At the same time, place the potato cores into the appropriate cups, take a picture, and leave them for 24 hours. Place them somewhere where they will not be disturbed. Decide who will come to record the second day data. 7. Start setting up your table in excel. Title (not the lab title) independent variable first column. For dependent variable, it will be the final mass and then you will calculate the percent mass change. To find this, use the following formula; (final mass – initial mass)/initial mass x 100. 8. In 24 hours, you will remove the cores using the tweezers, blot them dry and calculate their mass. Take a picture. 9. Record observations. 10. Once you are sure you are done, the potatoes go in the garbage, the cups are washed and dried, the razor/scalpel is washed and dried and all equipment returned. Requirements: 1. problem (given) and proper hypothesis 2. independent and dependent variables and 3 good variables to control with reasons why they need to be controlled 3. A brief recap of the procedure, in paragraph form, with pictures supporting the explanation 4. proper table and observations 5. graph with line of best fit (it will involve negative and positive numbers) 6. analysis the graph by stating the relationship and what that means 7. on a separate page, answer the following questions 8. Note that I will be evaluating your lab skills in this lab – whether you are prepared, know what you are doing, stay on task, work with others, know how to use equipment properly and safely. See rubric below. Questions 1. From your observations, is there any evidence to suggest that water has entered the potato cells? Explain. 2. What is the slope line of your graph showing, what is the trend? 3. When the slope line crosses the zero point, what does this mean? 4. From you data, how can you determine the water concentration of the potato. Explain. 5. Which would provide more reliable data, the class average or your own group’s data? Explain 6. When food is pickled, as much water as possible must be removed from the cells. How would you accomplish this? On the next page, are the parts of the lab checklist that you will be graded on. Note – is on wiki. If you have a problem, make sure you consult at my lab write up doc first. Each of the aspects will be marked on a scale of 0-3. 3 = exceeds expecations expected at this level 2 = meets expections at this level 1 = partially meets expections, some work required 0 = does not meet expections Problem/Question My hypothesis includes my reasoning and contains specific quantitative/measureable expectations which may be based on models (where applicable) Designs a method I have listed the independent and dependent variables – realizing that there can only one of each and (I’ve been given a brief statement of their relationship) in hypothesis instead? I have listed the important variables to control and stated why they need to be controlled (expanded in the procedure if necessary) A control group is described where needed I have written a clear, logical method that is sequential in order and repeatable by others Collection and presentation of data I have presented the appropriate data in a suitable format that is easy to interpret and logical to follow. It is word-processed or in Excel and any necessary additional observations are included I have set up any tables properly; descriptive title, independent variable first column, column headings, units with uncertainty, all data shown and compliments uncertainty. If drawings used; descriptive title, in pencil, appropriate size, labels correctly drawn and explanations where needed Data processing I have processed the correct data appropriately, shown formulas with worked examples of the processing and used proper number of decimal places in calculations I have used some method of summarizing the processed data, preferably as a graph. For graphs; correct type used, descriptive title, averages used, axis labeled and units given, variables on correct axis, line of best fit were appropriate, ability to manipulate excel or similar program used for graphing. This is the rubrics I will use for lab skills. Rubrics for lab skills Excellent = skill is observed all the time and at an above average standard level Good/very good – skill is observed most of the time and/or at an average or above average standard level Fair = skill is observed only some of the time and/or at an average or below average standard level Below standard = skill is rarely or never observed and/or at a below standard level Name ___________________________________________________ Skill Preparation Follows instructions Carrying out techniques Safety and techniques Work ethic Excellent Obviously read the lab through, asks pertinent questions Follows instructions accurately, adapts to new circumstances Competent and methodical in the use of techniques and equipment Consistently uses standard equipment safely as instructed Works effectively and efficiently with their group and by themselves V Good - Good Appears to understand the lab, asks some needless questions Fair Doesn’t really understand the lab, asks a lot of needless questions Below standard Not prepared to work, wastes time as is so ill prepared Follows instructions but requires assistance Follows most instructions and/or requires supervision Rarely follows instructions and requires constant supervision Usually competent and Sometimes competent Rarely competent or methodical in most and/or not methodical methodical in techniques/equipment in techniques/equipment techniques/equipment Generally uses standard equipment safely as instructed Uses standard equipment safety under supervision Requires constant supervision, has little regard to safety Mostly works effectively and efficiently, minimal non work interaction Generally works effectively but not efficiently, some group interaction Gets little work done in time period and/or a lot of non work interaction
