Osmosis & Diffusion Lab Report: Potato Cores, Onion Cells
advertisement
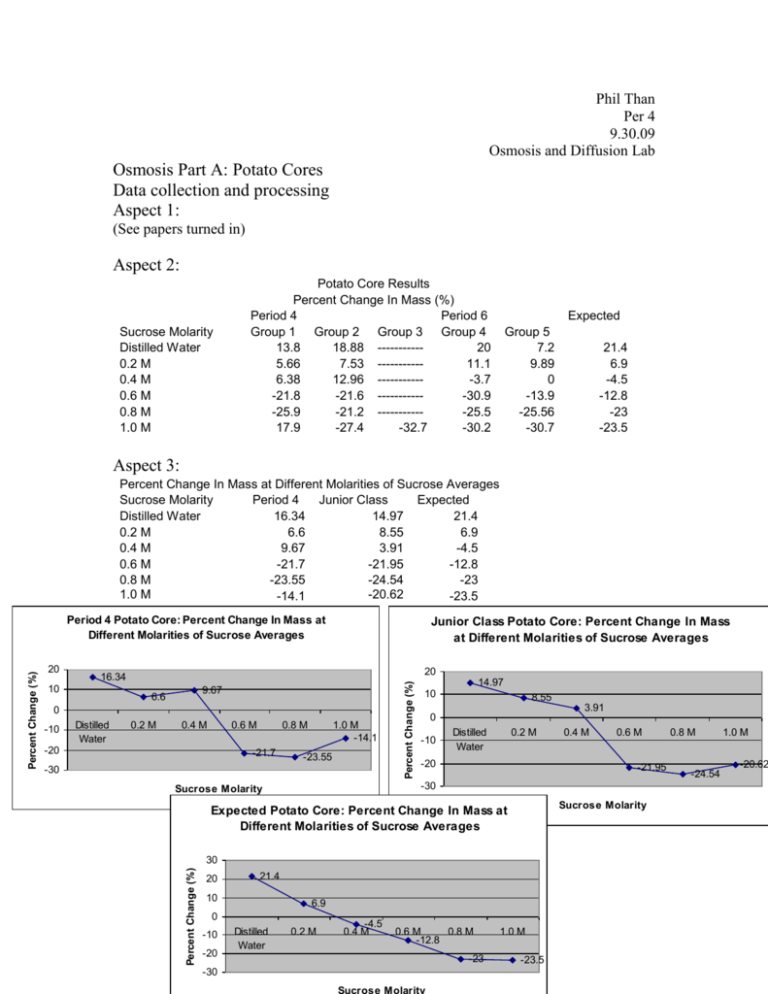
Phil Than Per 4 9.30.09 Osmosis and Diffusion Lab Osmosis Part A: Potato Cores Data collection and processing Aspect 1: (See papers turned in) Aspect 2: Sucrose Molarity Distilled Water 0.2 M 0.4 M 0.6 M 0.8 M 1.0 M Potato Core Results Percent Change In Mass (%) Period 4 Period 6 Group 1 Group 2 Group 3 Group 4 13.8 18.88 ----------20 5.66 7.53 ----------11.1 6.38 12.96 -----------3.7 -21.8 -21.6 -----------30.9 -25.9 -21.2 -----------25.5 17.9 -27.4 -32.7 -30.2 Expected Group 5 7.2 9.89 0 -13.9 -25.56 -30.7 21.4 6.9 -4.5 -12.8 -23 -23.5 Aspect 3: Percent Change In Mass at Different Molarities of Sucrose Averages Sucrose Molarity Period 4 Junior Class Expected Distilled Water 16.34 14.97 21.4 0.2 M 6.6 8.55 6.9 0.4 M 9.67 3.91 -4.5 0.6 M -21.7 -21.95 -12.8 0.8 M -23.55 -24.54 -23 1.0 M -20.62 -14.1 -23.5 Junior Class Potato Core: Percent Change In Mass at Different Molarities of Sucrose Averages 20 16.34 10 9.67 6.6 0 -10 Distilled Water 0.2 M 0.4 M 0.6 M -20 0.8 M -21.7 1.0 M -14.1 -23.55 -30 Percent Change (%) 20 14.97 10 8.55 3.91 0 -10 Distilled Water 0.2 M -20 Sucrose Molarity 30 21.4 10 6.9 0 -10 -20 -30 Distilled Water 0.6 M -21.95 Expected Potato Core: Percent Change In Mass at Different Molarities of Sucrose Averages 20 0.4 M -30 Sucrose Molarity Percent Change (%) Percent Change (%) Period 4 Potato Core: Percent Change In Mass at Different Molarities of Sucrose Averages 0.2 M -4.5 0.4 M 0.6 M 0.8 M -12.8 -23 1.0 M -23.5 0.8 M -24.54 1.0 M -20.62 Students used and shared the same materials (beakers, solutions, droppers, funnels, flasks, etc) to carry out their labs which could have resulted in cross contamination of said materials. Another error is the inaccurate measurements of the students when adding solution into the beaker. Since students used different materials for actually measuring the volume of solution added, the volumes were different from other groups’ volumes. The inaccuracy of the scale could have skewed the results of the mass of the potatoes. The amount of time the potato was in the solution could have been an error because some of the potato cores had more exposure to the solution than others, possibly skewing the results. Conclusion and evaluation From the data, it can be concluded that osmosis occurred between the potato cores and the sucrose solutions. Osmosis is the movement of water down its concentration gradient. In regards to the experiment, when the solution in the beaker was hypotonic to the hypertonic nature of the potato cores, water diffused from the solution to the potato cores; thus, increasing the mass of the potato cores. This can be seen from the data observed from the experiment. In distilled water, the potato cores gained the most mass, about a 16.34% and 14.97% increase, because water moved from the outside into the potato cores, because the distilled water was very hypotonic in comparison to the potato cores. Still, at 0.2 M of sucrose solution, the solution is still more hypotonic than the potato cores, so water diffused into the potato cores, increasing the mass about 6.6% and 8.55%, to balance the solute concentrations, in and out of the potato cores. At 0.4 M of sucrose solution, the expected result was that the potato core would lose about -4.5% mass, due to the hypertonic sucrose solution. What really occurred was that the potato cores still gained mass, around 9.67% and 3.91% increase, in Period 4 and the junior class, respectively. Only at 0.6 M of sucrose solution, does the potato core, in both data sets, actually lose mass; in period 4 around -21.7% change and in the junior class a 21.95% change in mass. This decrease in mass shows that water diffused out of the potato core and into the surrounding solution, because at 0.6 M of sucrose solution, the solute concentration in the potato core was lower than the outside; therefore, water had to diffuse out in order to balance the concentrations. A limitation of this lab was the time and the resources used. There was not enough to perform the lab entirely as an individual or in groups, so the splitting up of procedure limited the ability to obtain accurate results. The resources was a limiting factor because we had to rely on other’s results which also limited the ability to obtain results because the more students performing experiment, the more an error is likely to occur. The lack of accurate measurements also limited the ability to have a control of variables such as the amount of solution in the beakers. Improvements to this lab include more time to perform the experiments, more accurate materials (scales, flasks, beakers), and more materials (i.e. potatoes). Another improvement to this lab is to eliminate the sharing of materials, giving each group their own materials, including solutions, so as to rid the possibility of cross contamination. Osmosis Part B: Data collection and processing Aspect 1: (See papers turned in) Aspect 2: Normal Onion Cell Normal, healthy looking cells. Purple. With NACL Cells are smaller/shrunken. Cytoplasm seems nonexistent. Traces of purple. Flooded with Water Cells regain some of their original structure. But still, shrunken. Traces of purple, still. Aspect 3: Errors included the amount of NACL and Water added. Excess NACL and Water could have been added, or not enough NACL and water were added, skewing the results. Microscopy errors could have resulted and problems with the onion skin could have skewed the results. Another error could be an error in preparing the slides. Conclusion and evaluation Based on what we observed under the microscope, it can be concluded that osmosis occurred when the NACL was added to the slide and when the onion skin was flooded with water. When the NACL was added, the cytoplasm of the cells diffused out in order to balance the concentrations and when water was flooded into the slide, some of the water diffused back into the cells. The shrunken cells after the NACL was added was proof that the cytoplasm diffused out and the increase in size when the water was added, shows that water really did diffuse back into the cells. Again, a limitation when doing this lab was the time. The short amount of time did not allow the wait for the salt water and the water to work at their full potential. As soon as the NACl was added, the slide was put back under the microscope, and same with the water. If more time was allotted, the exposure of NACL and water could have been increased, allowing maximum results. Another limitation was the ability to obtain a piece of purple onion skin. Students tore the onion up, disallowing latter groups to obtain a good piece of skin to observe. Another limitation is the microscopes used. The microscopes used were only able to magnify up to 40x, not the recommended 100x. This means that it limited the ability to be able to observe the occurrences happening in, out, and to the cell. The onion itself was a limitation because many students touched the onion which could’ve damaged the onion, yielding undesirable results. An improvement to this lab would be to increase the time allotted to perform the experiment. This would decrease the amount of errors and could yield better results. Better materials like microscopes would help observe the cell more in-depth to really see what is happening to the cell. Another improvement is to have more than one onion, in order to get better skin samples, and reduce the risk of damaging the onion which could lead to bad results. Osmosis Part C Data collection and processing Aspect 1: (See papers turned in) Aspect 2: Dialysis Bag Results Period 4 Period 6 Solution Concentration Distilled Water 0.2 M 0.4 M 0.6 M 0.8 M 1.0 M Group 1 -4.16 0 7.69 9.09 10.7 14.8 Group 2 0 4 8 6.8 11.1 19.05 Group 3 --------------------------------------------------8.21 Group 4 0 4.4 8.63 11.22 16 12 Expected Group 5 -12.2 1.53 11.1 ----------16 20 1.2 3.1 7.7 11 14.8 18.2 Aspect 3: Dialysis Bag Percent Change In Mass (%) Solution Period Junior Expected Concentration 4 Class Distilled Water -2.08 -4.09 1.2 0.2 M 2 2.48 3.1 0.4 M 7.85 8.86 7.7 0.6 M 7.94 9.04 11 0.8 M 10.9 13.45 14.8 1.0 M 14.02 14.81 18.2 Period 4 Dialysis Bag Percent Change In Mass 14.02 10.9 10 7.85 20 18.2 15 14.8 11 10 7.7 5 0 1.2 Distilled Water 3.1 0.2 M 7.94 0.4 M 0.6 M 0.8 M 1.0 M Solution Concentration 5 2 0 -5 -2.08 0.2 M Distilled Water 0.4 M 0.6 M 0.8 M 1.0 M Solution Concentration Junior Class Dialysis Bag Percent Change In Mass Percent Change In Mass (%) Percent Change(%) 15 Percent Change (%) Expected Dialysis Bag Percent Change In Mass 20 15 13.45 10 8.86 14.81 9.04 5 0 -5 2.48 Distilled -4.09 0.2 M Water 0.4 M 0.6 M -10 Solution Concentration 0.8 M 1.0 M A big, possible error in the experiment was the results that came out to be a negative or 0% change in mass. This could be due to a leakage in the dialysis bag which, leaked solutions in and out of the bag. Another error was the sharing of materials and solutions which could have led to cross contamination, which could have skewed the results in a negative way. Inaccurate measurements of volume and mass could be another error. Conclusion and evaluation In this experiment, an orange solution of 15% glucose and 1% starch was added into semi-permeable dialysis bags, which were then placed into a beaker containing H2O + IKI, which was amber colored. Because the dialysis bags were semi-permeable, it allowed select solutions and solutions to diffuse through. In this case, the iodine was small enough to permeate through and diffuse through the bag, reacting with the starch producing a black precipitate at the bottom of the bag. In contrast, the starch was too big to go through the semi-permeable membrane, so it stayed in the dialysis bag, which led to the iodine reacting with it. This experiment mimics the semi-permeable membrane of cells in that the cell membrane is selective on what goes through. When distilled water was in the beaker, the expected result was a increase of mass of 1.2%. But instead, a negative change occurred, ending in a 2.08% average change in period 4 and a -4.09% change in the junior class average. As expected, as the concentration of glucose in the bags increased, the percent change in mass also increased. This is due to the fact that more solution needed to diffuse through to the bags to balance the concentration gradient difference between the two surroundings. A limitation of this experiment was the fact that we had to rely on other students’ results. The more people that perform the labs increases the amount of possible errors that can occur. Time was also a limitation because some bags did not have a precipitate on the bottom because of the time constraints, and not letting the experiment run for as long as we wanted to. The main improvement to this lab would be to increase the amount of time to do perform the lab. Increasing the time would allow the reactions to take place and allow the iodine to diffuse through. Also, more time would allow the students to perform the whole lab in their groups, and not in sections. This will allow more results which can produce a better and more accurate data series. Another improvement would be to give students their own separate materials, like glucose solution, measuring instruments, etc, in an attempt to eliminate the possibility of cross contamination, which could’ve altered the results.
