Wirral KS2/KS3 Transition Unit – Handling Data
advertisement
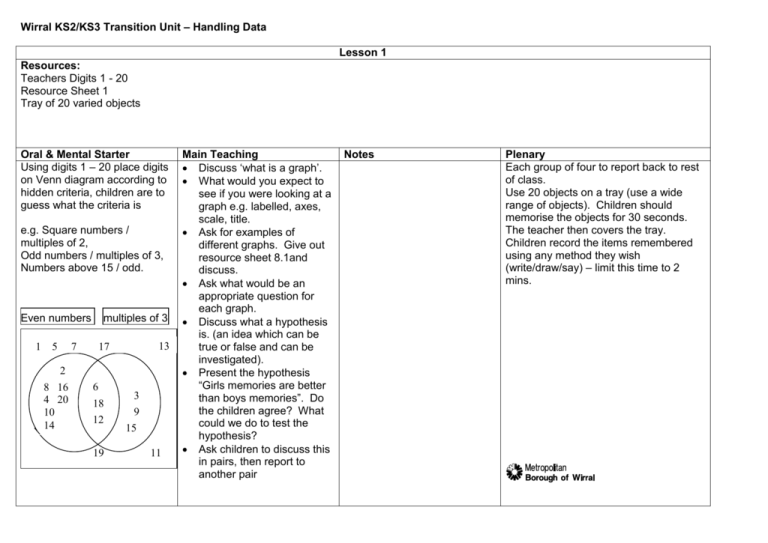
Wirral KS2/KS3 Transition Unit – Handling Data Lesson 1 Resources: Teachers Digits 1 - 20 Resource Sheet 1 Tray of 20 varied objects Oral & Mental Starter Using digits 1 – 20 place digits on Venn diagram according to hidden criteria, children are to guess what the criteria is e.g. Square numbers / multiples of 2, Odd numbers / multiples of 3, Numbers above 15 / odd. Even numbers 1 5 2 8 16 4 20 10 14 multiples of 3 7 13 33 17 6 18 8 12 19 3 9 15 11 Main Teaching Discuss ‘what is a graph’. What would you expect to see if you were looking at a graph e.g. labelled, axes, scale, title. Ask for examples of different graphs. Give out resource sheet 8.1and discuss. Ask what would be an appropriate question for each graph. Discuss what a hypothesis is. (an idea which can be true or false and can be investigated). Present the hypothesis “Girls memories are better than boys memories”. Do the children agree? What could we do to test the hypothesis? Ask children to discuss this in pairs, then report to another pair Notes Plenary Each group of four to report back to rest of class. Use 20 objects on a tray (use a wide range of objects). Children should memorise the objects for 30 seconds. The teacher then covers the tray. Children record the items remembered using any method they wish (write/draw/say) – limit this time to 2 mins. Wirral KS2/KS3 Transition Unit – Handling Data Lesson 2 Resources: Hall or outside use. Digital camera. Resource sheet 1 examples data collection charts. Large no’s 1 – 20. Oral & Mental Starter Use SATs question example for missing numbers on Pie Chart. (Resource Sheet 2) Main Teaching Ask/remind children of how they are going to collect and record the data. Show 4 examples. Which of data collection charts would be most appropriate? (Resource Sheet 3) Run experiment. Record results. Skipping ropes. Resource sheet 2 SAT question - Pie Chart Resource sheet 3. Notes Plenary (Allow 15 - 20 mins) Go to hall or playground. Children form human graphs. Note: group children for small classes in a range of answers e.g. 1-3, 4-6….Teacher to record using camera from above! Place numbers 1-20 on playground floor in line. Children stand behind their score. Could use different colour hats / bands to identify boys and girls. Take a photograph or record. Photo can be displayed and axes added to display, then labelled. Then Children form a circle keeping same ‘scores’ together. Use skipping ropes to centre to form pie chart to partition each group. Take photograph. Wirral KS2/KS3 Transition Unit – Handling Data Lesson 3 Resources: Numbers 100 or 3D shapes Bag Unifix cubes Oral & Mental Starter Choose a range of 3D shapes (or numbers to 100 etc.) Show children. Place shapes or numbers in a bag. Remove one secretively. Children to use ‘yes/no’ questions to find missing item repeat. Main Teaching Notes Examine data collection sheet. Discuss the range. In pairs, children to choose how best to represent the data they have collected. Report back to class Teacher to list suggestions (including different bar charts possibly identifying which are boys and which are girls. The children should come up with these ideas. Could also show horizontal and vertical bar chart)) Children draw graphs or use unifix cubes to create 3D representation. Ask how children are going to show the difference between boys and girls scores on their graphs. Plenary Discuss graphs produced. Do the graphs provide us with an answer to the hypothesis? Why wouldn’t you use a line graph? Which graph is the most useful in answering the hypothesis? Wirral KS2/KS3 Transition Unit – Handling Data Lesson 4 Resources: Calculators OHT of one graph produced yesterday Resource sheet 4 Oral & Mental Starter Produce a tally chart based on children’s favourite …. Use results to find Mean, Median and Mode Main Teaching Discuss and examine graphs (and data collection charts). Ask children in pairs to find the mode scores for boys and girls and median scores for boys and girls. Does this give us an answer to the hypothesis? Use resource sheet 2 to focus. If no, ask children how we can be more exact (use of average/mean scores). Provide calculators for pairs of children. Children refer to their graphs and produce questions to ask other children. Wirral KS2/KS3 Transition Unit – Handling Data Notes Plenary Use OHT of a graph. Children ask their questions. Teacher could ask What is the most common score? What do we call this? How many more children scored 10 than 7. How many children scored more than 10 etc. Lesson 5 Resources: Use of computer room with access to Interactive Teaching Programmes Resource Sheet 5 Resource Sheet 6 Oral & Mental Starter Use resource sheet 5 Main Teaching Notes Teacher shows children ITPs Data Handling and Line Graph. Children investigate how they can record their data in pairs at computers using ITPs. Plenary As a class go over questions on Resource Sheet 6 on OHT
