Data Table: The Affects of Different Water Types On Carrot Cell
advertisement
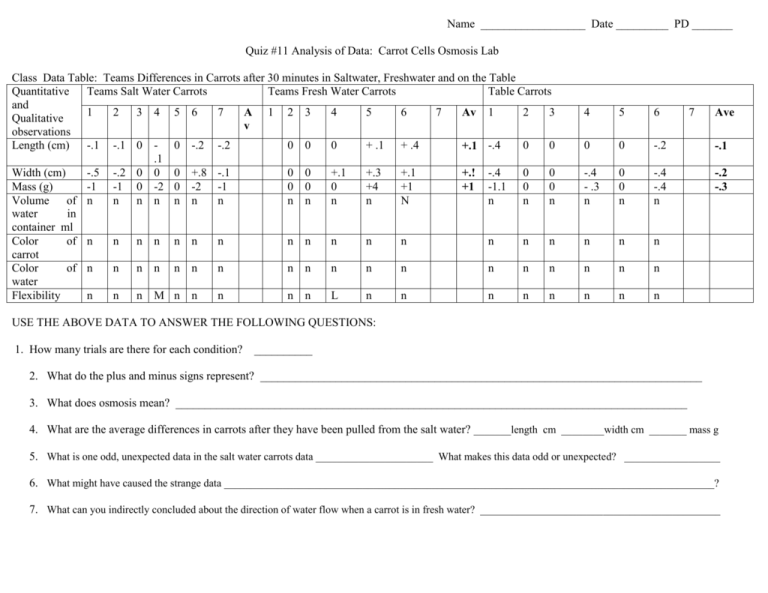
Name __________________ Date _________ PD _______ Quiz #11 Analysis of Data: Carrot Cells Osmosis Lab Class Data Table: Teams Differences in Carrots after 30 minutes in Saltwater, Freshwater and on the Table Quantitative Teams Salt Water Carrots Teams Fresh Water Carrots Table Carrots and 1 2 3 4 5 6 7 4 5 6 7 2 3 A 1 2 3 Av 1 Qualitative v observations Length (cm) -.1 -.1 0 - 0 -.2 -.2 0 0 0 + .1 + .4 0 0 +.1 -.4 .1 Width (cm) -.5 -.2 0 0 0 +.8 -.1 0 0 +.1 +.3 +.1 0 0 +.! -.4 Mass (g) -1 -1 0 -2 0 -2 -1 0 0 0 +4 +1 0 +1 -1.1 0 Volume of n n n n n n n n n n n N n n n water in container ml Color of n n n n n n n n n n n n n n n carrot Color of n n n n n n n n n n n n n n n water Flexibility n n n M n n n n n L n n n n n 4 5 6 7 0 0 -.2 -.1 -.4 - .3 n 0 0 n -.4 -.4 n -.2 -.3 n n n n n n n n n Ave USE THE ABOVE DATA TO ANSWER THE FOLLOWING QUESTIONS: 1. How many trials are there for each condition? __________ 2. What do the plus and minus signs represent? ____________________________________________________________________________ 3. What does osmosis mean? ________________________________________________________________________________________ 4. What are the average differences in carrots after they have been pulled from the salt water? _______length cm ________width cm _______ mass g 5. What is one odd, unexpected data in the salt water carrots data ______________________ What makes this data odd or unexpected? __________________ 6. What might have caused the strange data ____________________________________________________________________________________________? 7. What can you indirectly concluded about the direction of water flow when a carrot is in fresh water? _____________________________________________

