7-2: Estimating Population Proportions Notation: p = population
advertisement
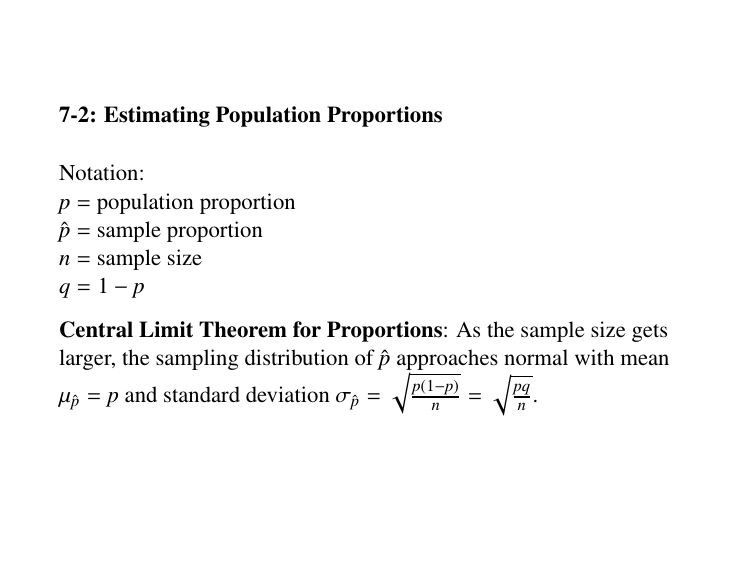
7-2: Estimating Population Proportions Notation: p = population proportion p̂ = sample proportion n = sample size q=1−p Central Limit Theorem for Proportions: As the sample size gets larger, the sampling distribution of p̂q approaches normal with mean q pq = µp̂ = p and standard deviation σp̂ = p(1−p) n n. 7-2: Estimating Population Proportions Example: According to Mars Chocolate North America, they produce plain M&M’s so that 24% are blue. In our sample from class, we found that 168 out of 811 plain M&M’s were blue. Find the probability of getting a sample of size 811 with less than 21% of the M&M’s being blue. 7-2: Point Estimates A point estimate is a single value used to give an estimate for the value of a population parameter. Example: From our sample of plain M&M’s we calculated the point estimate p̂ = .21 representing the percent of M&M’s that are blue. Sample statistics such as x̄, x̃, s, p̂, etc. are all point estimates. 7-2: Confidence Intervals A confidence interval is a range of values that give an estimate for the value of a population parameter. It can be written in one of the following forms: • statistic − E < parameter < statistic + E • statistic ± E • (statistic − E, statistic + E) Where E is the margin of error, that is, the maximum likely difference between the observed sample value and the population parameter. 7-2: Confidence Intervals A confidence interval must be accompanied by the confidence level which is the probability that the interval actually contains the population parameter. The confidence level gives the success rate of the procedure used to construct the confidence interval. Associated with each confidence level is a critical value, zα/2 , that is the z score separating an area of α/2 in the right tail of the standard normal distribution. 7-2: Estimating Population Proportions with Confidence Intervals A confidence interval with confidence level 1 − α for the proportion p of a population based upon a simple random sample of size n with sample proportion p̂ is given by: p̂ − E < p < p̂ + E p̂ ± E (p̂ − E, p̂ + E) Where E = zα/2 q p̂q̂ n. 7-2: Estimating Population Proportions with Confidence Intervals Example: In our sample from class, we found that 168 out of 811 plain M&M’s were blue. Find the 95% confidence interval for the proportion of all M&M’s that are blue. (Find the 99% confidence interval.) 7-2: Finding the Sample Size to Estimate a Population Proportion If we solve E = zα/2 q p̂q̂ n for n we obtain n= z2α/2 p̂q̂ E2 • This allows us to determine the sample size needed to estimate a population proportion with a confidence interval. • Here we use the best available information to estimate p̂. If we don’t have an estimate for p̂ we can use p̂ = .5. • If the computed sample size is not a whole number, round up to the next larger whole number. 7-2: Finding the Sample Size to Estimate a Population Proportion How many M&M’s must be sampled in order to be 95% confident that the sample percentage is in error by no more than one percentage point?
