Estimating a Population Proportion Notes
advertisement
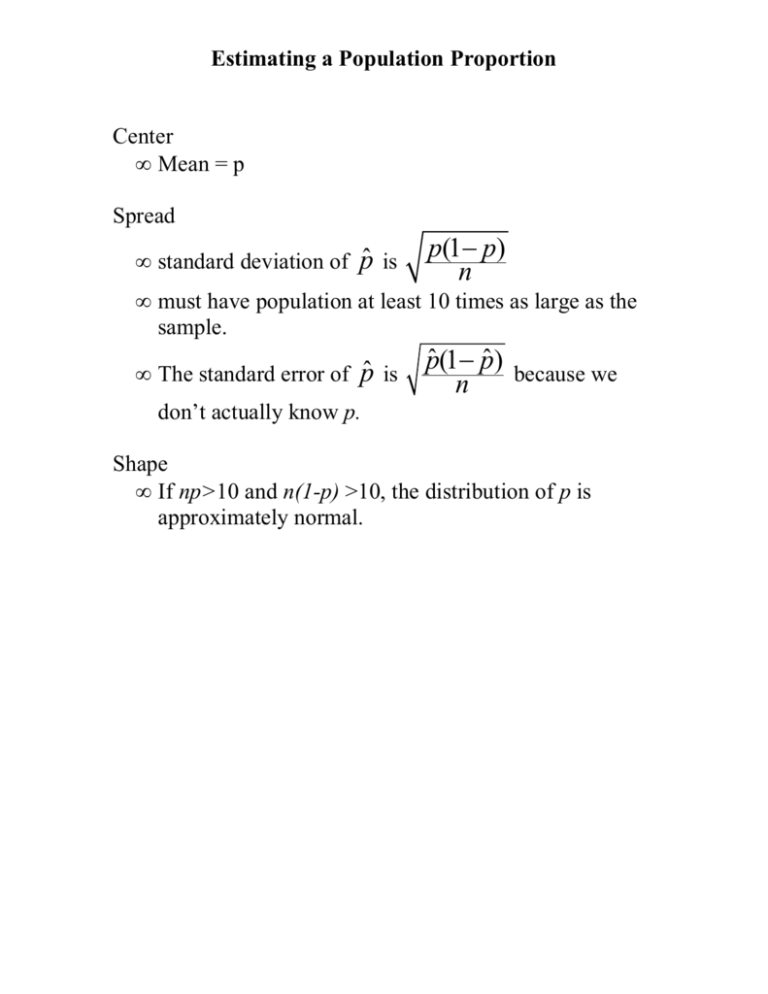
Estimating a Population Proportion Center • Mean = p Spread • standard deviation of p̂ is p(1− p) n • must have population at least 10 times as large as the sample. • The standard error of p̂ is pˆ (1n− pˆ ) because we don’t actually know p. Shape • If np>10 and n(1-p) >10, the distribution of p is approximately normal. Confidence Interval for a Population Proportion 1) State what you are estimating and the population. 2) Conditions: • SRS • Normality: npˆ >10 and n(1− pˆ ) >10 • Independence: Each observation is independent. When sampling without replacement, the population is at least 10 times as large as the sample. 3) pˆ (1− pˆ ) pˆ ± z * 4) Interpretation n Sample Size for a Desired Margin of Error Given we are looking for a margin of error of would set the expression to be ≤ m . z* p*(1− p*) ≤m n ≤ m . We Example: An automobile manufacturer would like to know what proportion of its customers are not satisfied with the service provided by the local dealer. The customer relations department will survey a random sample of customers and compute a 99% confidence interval for the proportion who are not satisfied. a) Past studies suggest that 20% of customers will not be satisfied. What will the sample size have to be in order to have a margin of error of 0.015? 2.576 .2(.8) = .015 n n = 4718.77 ~ 4719 b) When the SRS is actually contacted, 10% of the sample say they are not satisfied. Construct a 99% confidence interval using the inference steps. We are estimating the proportion of dissatisfied customers at a local dealership. Our population is all customers at the dealership. We are using an SRS of customers In order to check normality: np ≥ 10 and nq ≥ 10 . In order to check independence, we need to check that the population is at least 10 times as large as the sample. The interval is: We are 99% confident that the true proportion is between this interval.


