Grouped data – Weighted data Grouped data Count and mean
advertisement

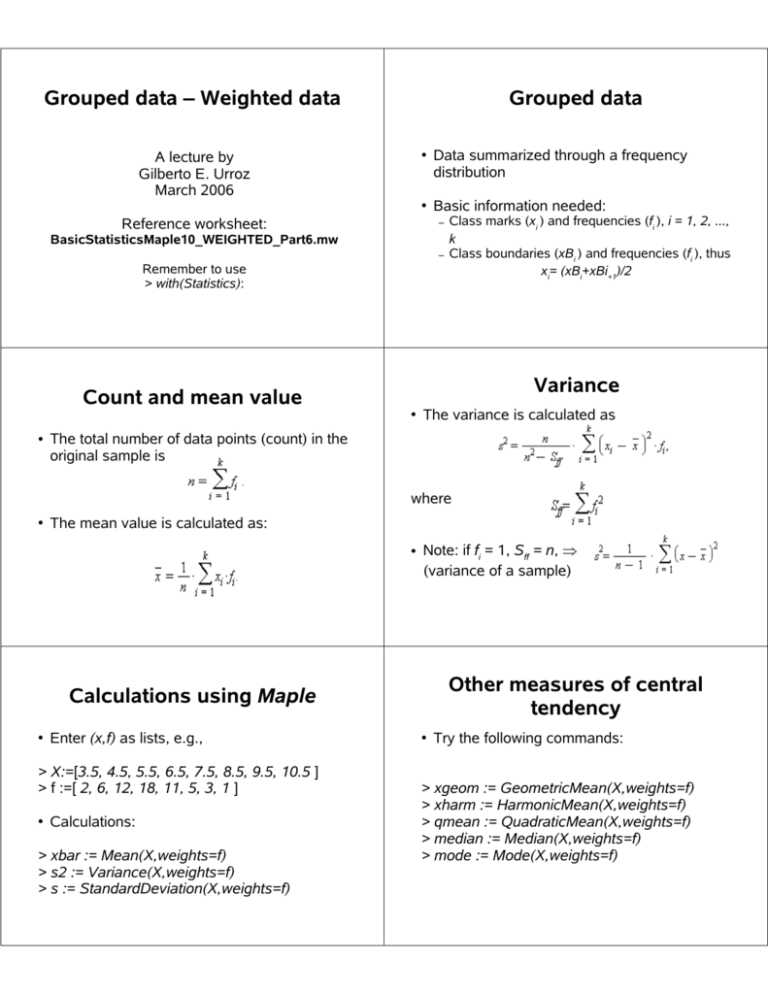
Grouped data – Weighted data Grouped data A lecture by Gilberto E. Urroz March 2006 ● ● Reference worksheet: Data summarized through a frequency distribution Basic information needed: – BasicStatisticsMaple10_WEIGHTED_Part6.mw – Remember to use > with(Statistics): Variance Count and mean value ● ● Class marks (xi ) and frequencies (fi ), i = 1, 2, ..., k Class boundaries (xBi ) and frequencies (fi ), thus xi= (xBi+xBi+1)/2 The variance is calculated as The total number of data points (count) in the original sample is where ● The mean value is calculated as: ● Note: if fi = 1, Sff = n, ⇒ (variance of a sample) Other measures of central tendency Calculations using Maple ● Enter (x,f) as lists, e.g., > X:=[3.5, 4.5, 5.5, 6.5, 7.5, 8.5, 9.5, 10.5 ] > f :=[ 2, 6, 12, 18, 11, 5, 3, 1 ] ● Calculations: > xbar := Mean(X,weights=f) > s2 := Variance(X,weights=f) > s := StandardDeviation(X,weights=f) ● Try the following commands: > xgeom := GeometricMean(X,weights=f) > xharm := HarmonicMean(X,weights=f) > qmean := QuadraticMean(X,weights=f) > median := Median(X,weights=f) > mode := Mode(X,weights=f) ● Other measures of spread or variation Data summary on grouped data Try the following commands: ● > meandeviation := MeanDeviation(X,weights = f) > mediandeviation := MedianDeviation(X,weights = f) > xrange := Range(X,weights = f) > IQR := interquartileRange(X,weights = f) > CoeffOfVariation := Variation(X,weights = f) > Q1 := Quartile(X, 1, weights = f) > Q3 := Quartile(X, 3, weights = f) > D6 := Percentile(X, 60, weights = f) > P35 := Percentile(X, 35, weighte = f) > Xv := convert(X,vector) > fv := convert(f,vector) > DataSummary(Xv, weights = fv) Finding class marks given classes Five-point summary on grouped data ● Needs data in vector format > Xv := convert(X,vector) > fv := convert(f,vector) > FivePointSummary(Xv, weights = fv) Needs data in vector format Enter classes as ranges: >classes:=[2..2.95,3..4.95, ..., 8..9.95] ● ● Class marks are calculated as follows: > k := nops(classes) > Finding classes given class marks - 1 ● ● Simplest approach: given class marks: X := [X1, ..., Xk] Finding classes given class marks - 2 ● Use the following user-defined function: ● XLimits:=GetClassLimits(X) Assume lowest class limit is: XL1 = X1-(X2-X1)/2 ● Remaining class limits are calculated as: Xlj+1 = 2Xj – Xlj, for j = 1, 2, ..., k Frequency Table for Grouped Data - 1 ● Given class limits, XL, and frequencies, f, as lists, form a tally list, e.g., Frequency Table for Grouped Data - 2 ● Function TallyFrequencyTable: >Xfreq:=[seq(XLj ..Xlj+1 = fj , j = 1..k) ] ● Use function TallyFrequencyTable to generate the frequency table: >TallyFrequencyTable(Xfreq) Frequency Table for Grouped Data - 2 Application of TallyFrequencyTable: >TallyFrequencyTable(Xfreq) ● Histogram for Grouped Data - 1 ● Use function TallyHistogram: Histogram for Grouped Data - 1 ● Use function TallyHistogram: Histogram for Grouped Data - 2 >TallyHistogram(Xfreq, magenta) Weighted data Weighted data grouping ● ● ● Sample with repeating numbers: Data can be grouped into data points (XV) and frequency counts (Xf) Data summary for weighted data ● Tally and separate values and frequencies: Convert lists XV and Xf to vectors, then use function DataSummary Five point summary for weighted data ● Use function FivePointSummaryI(XVV): Note: re-defining 'median' before summarizing data. Frequency table for weigthed data ● Use function TallyFrequencyTable(XL): Bar chart for weighted data


