STEP BY STEP The Weighted Mean: Occasionally a researcher will
advertisement

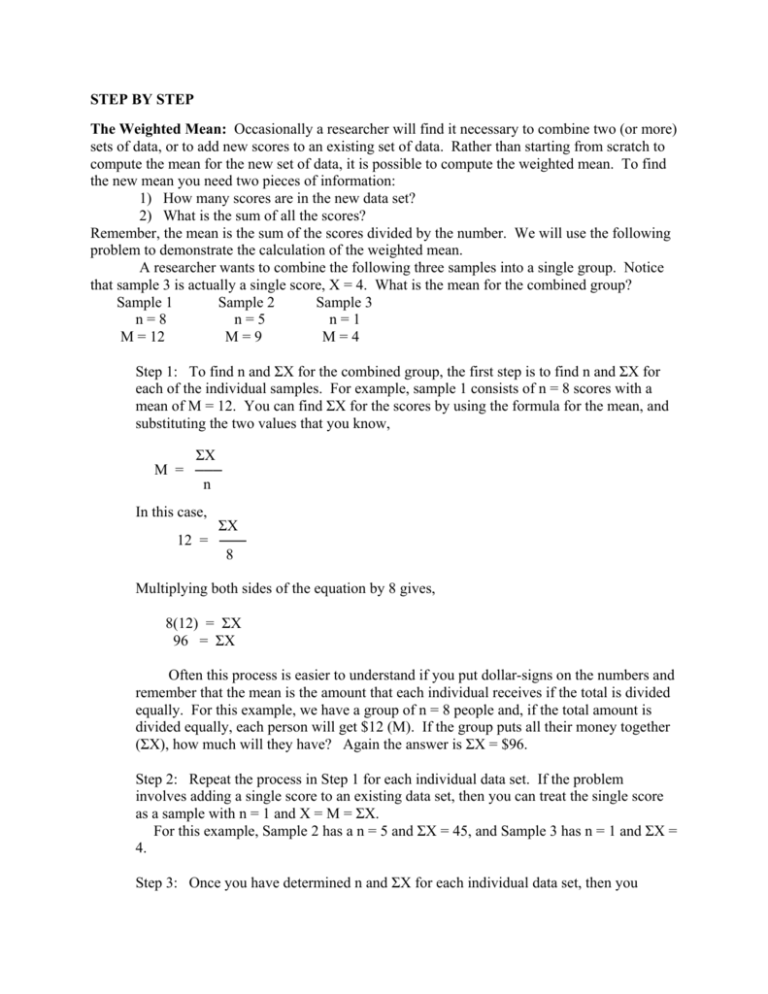
STEP BY STEP The Weighted Mean: Occasionally a researcher will find it necessary to combine two (or more) sets of data, or to add new scores to an existing set of data. Rather than starting from scratch to compute the mean for the new set of data, it is possible to compute the weighted mean. To find the new mean you need two pieces of information: 1) How many scores are in the new data set? 2) What is the sum of all the scores? Remember, the mean is the sum of the scores divided by the number. We will use the following problem to demonstrate the calculation of the weighted mean. A researcher wants to combine the following three samples into a single group. Notice that sample 3 is actually a single score, X = 4. What is the mean for the combined group? Sample 1 Sample 2 Sample 3 n=8 n=5 n=1 M = 12 M=9 M=4 Step 1: To find n and ΣX for the combined group, the first step is to find n and ΣX for each of the individual samples. For example, sample 1 consists of n = 8 scores with a mean of M = 12. You can find ΣX for the scores by using the formula for the mean, and substituting the two values that you know, ΣX M = ─── n In this case, ΣX 12 = ─── 8 Multiplying both sides of the equation by 8 gives, 8(12) = ΣX 96 = ΣX Often this process is easier to understand if you put dollar-signs on the numbers and remember that the mean is the amount that each individual receives if the total is divided equally. For this example, we have a group of n = 8 people and, if the total amount is divided equally, each person will get $12 (M). If the group puts all their money together (ΣX), how much will they have? Again the answer is ΣX = $96. Step 2: Repeat the process in Step 1 for each individual data set. If the problem involves adding a single score to an existing data set, then you can treat the single score as a sample with n = 1 and X = M = ΣX. For this example, Sample 2 has a n = 5 and ΣX = 45, and Sample 3 has n = 1 and ΣX = 4. Step 3: Once you have determined n and ΣX for each individual data set, then you simply add the individual n values to find the number of scores in the combined set. In the same way, you simply add the ΣX values to find the overall sum of the scores in the combined data set. For this example, combined n = 8 + 5 + 1 = 14 combined ΣX = 96 + 45 + 4 = 145 Step 4: Finally you compute the mean for the combined group using the regular formula for M. M = ΣX/n = 145/14 = 10.36 HINTS AND CAUTIONS 1. One of the most common errors in computing central tendency occurs when students are attempting to find the mean for data in a frequency distribution table. You must remember that the frequency distribution table condenses a large set of scores into a concise, organized distribution; the table does not list each of the individual scores. One way of avoiding confusion is to transform the frequency distribution table back into the original list of scores. For example, the following frequency distribution table presents a distribution for which three individuals had scores of X = 5, one individual had X = 4, four individuals had X = 3, no one had X = 2, and two individuals had X = 1. When each of these scores is listed individually, it is much easier to see that N = 10 and ΣX = 33 for these data. Frequency Distribution X f 5 3 4 1 3 4 2 0 1 2 Original X Values 5 5 5 4 3 3 3 3 1 1 2. Many students incorrectly assume that the median corresponds to the midpoint of the range of scores. For example, it is tempting to say that the median for a 100-point test would be X = 50. Be careful! The correct interpretation is that the median divides the set of scores (or individuals) into two equal groups. On a 100-point test, for example, the median could be X = 95, if the test was very easy and most of the class had very high scores. You must know where the individual scores are located before you can find the median. Often it is easy to locate the median if you sketch a histogram of the frequency distribution. If each score is represented by a "block" in the graph, you can find the median by positioning a vertical line so that it divides the blocks into two equal piles.


