Psychology Research Methods Worksheet
advertisement
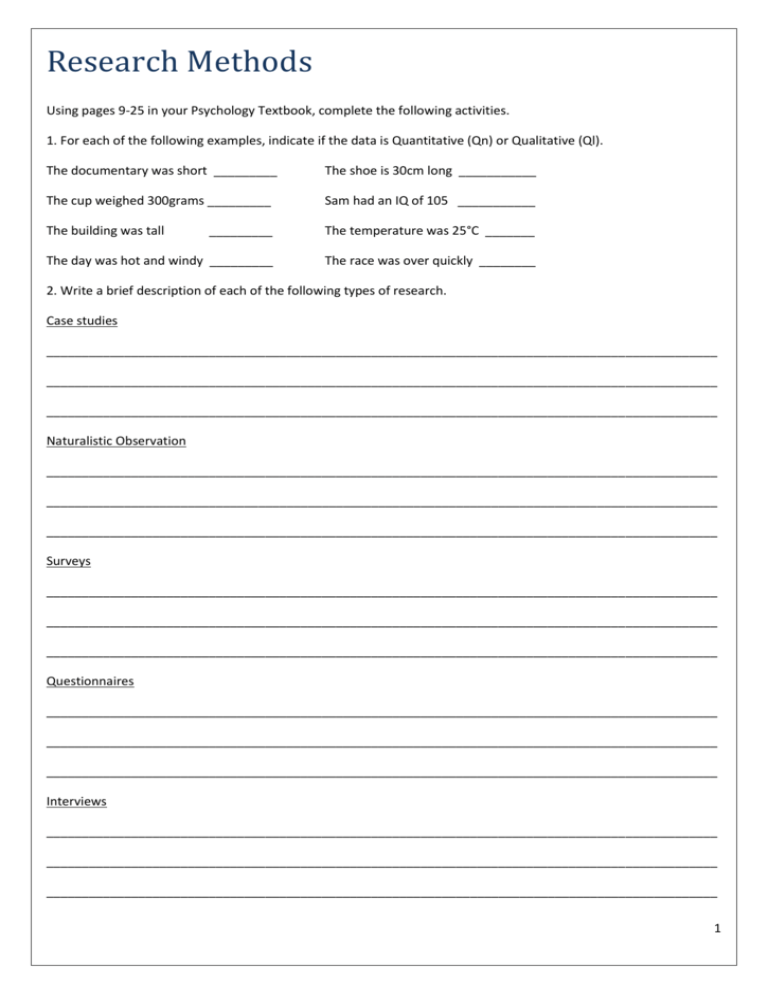
Research Methods Using pages 9-25 in your Psychology Textbook, complete the following activities. 1. For each of the following examples, indicate if the data is Quantitative (Qn) or Qualitative (Ql). The documentary was short _________ The shoe is 30cm long ___________ The cup weighed 300grams _________ Sam had an IQ of 105 ___________ The building was tall _________ The temperature was 25°C _______ The day was hot and windy _________ The race was over quickly ________ 2. Write a brief description of each of the following types of research. Case studies _______________________________________________________________________________________________ _______________________________________________________________________________________________ _______________________________________________________________________________________________ Naturalistic Observation _______________________________________________________________________________________________ _______________________________________________________________________________________________ _______________________________________________________________________________________________ Surveys _______________________________________________________________________________________________ _______________________________________________________________________________________________ _______________________________________________________________________________________________ Questionnaires _______________________________________________________________________________________________ _______________________________________________________________________________________________ _______________________________________________________________________________________________ Interviews _______________________________________________________________________________________________ _______________________________________________________________________________________________ _______________________________________________________________________________________________ 1 Rating Scales _______________________________________________________________________________________________ _______________________________________________________________________________________________ _______________________________________________________________________________________________ Standardised Tests _______________________________________________________________________________________________ _______________________________________________________________________________________________ _______________________________________________________________________________________________ Non-Standardised Tests _______________________________________________________________________________________________ _______________________________________________________________________________________________ _______________________________________________________________________________________________ Longitudinal Studies _______________________________________________________________________________________________ _______________________________________________________________________________________________ _______________________________________________________________________________________________ Twin and Adoption Studies _______________________________________________________________________________________________ _______________________________________________________________________________________________ _______________________________________________________________________________________________ Correlational Studies _______________________________________________________________________________________________ _______________________________________________________________________________________________ _______________________________________________________________________________________________ 3. What are descriptive statistics? _______________________________________________________________________________________________ _______________________________________________________________________________________________ 2 4. Calculate the mean, median and mode of the following tests scores out of 100, gained by a class of psychology students on a research methods test: 100, 100, 19, 80, 97, 65, 88, 38, 74, 77, 65, 69, 65, 79, 88, 91, 65, 49, 59, 99, 89, 48, 28, 74, 84, 57, 62, 77, 29, 73 Mean = __________ Median = ___________ Mode = ___________ 5. Using the scores below, fill in the frequency distribution table. 11, 59, 88, 85, 57, 13, 62, 89, 84, 57, 19, 64, 89, 80, 55, 28, 65, 91, 79, 49, 65, 29, 97, 48, 77, 37, 69, 99, 38, 74 Frequency Distribution Table Interval Frequency 0-19 20-39 40-59 60-79 80-99 Total Present this data in the form of a histogram or polygon. 3 6. What is a normal distribution? _______________________________________________________________________________________________ _______________________________________________________________________________________________ _______________________________________________________________________________________________ 7. Draw a graph of: a normal distribution, bimodal distribution, positively skewed distribution and negatively skewed distribution. 8. Complete activity 1.7 in the Student Activity Manual (page 17). 4
