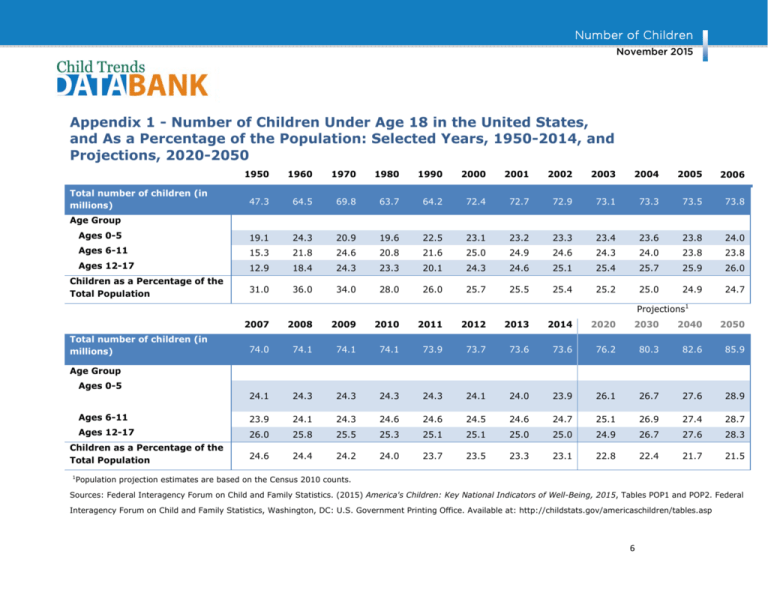
Appendix 1 - Number of Children Under Age 18 in the
advertisement

Number of Children November 2015 Appendix 1 - Number of Children Under Age 18 in the United States, and As a Percentage of the Population: Selected Years, 1950-2014, and Projections, 2020-2050 1950 1960 1970 1980 1990 2000 2001 2002 2003 2004 2005 2006 47.3 64.5 69.8 63.7 64.2 72.4 72.7 72.9 73.1 73.3 73.5 73.8 Ages 0-5 19.1 24.3 20.9 19.6 22.5 23.1 23.2 23.3 23.4 23.6 23.8 24.0 Ages 6-11 15.3 21.8 24.6 20.8 21.6 25.0 24.9 24.6 24.3 24.0 23.8 23.8 Ages 12-17 12.9 18.4 24.3 23.3 20.1 24.3 24.6 25.1 25.4 25.7 25.9 26.0 31.0 36.0 34.0 28.0 26.0 25.7 25.5 25.4 25.2 25.0 24.9 24.7 Total number of children (in millions) Age Group Children as a Percentage of the Total Population Projections1 2007 2008 2009 2010 2011 2012 2013 2014 2020 2030 2040 2050 74.0 74.1 74.1 74.1 73.9 73.7 73.6 73.6 76.2 80.3 82.6 85.9 24.1 24.3 24.3 24.3 24.3 24.1 24.0 23.9 26.1 26.7 27.6 28.9 Ages 6-11 23.9 24.1 24.3 24.6 24.6 24.5 24.6 24.7 25.1 26.9 27.4 28.7 Ages 12-17 26.0 25.8 25.5 25.3 25.1 25.1 25.0 25.0 24.9 26.7 27.6 28.3 24.6 24.4 24.2 24.0 23.7 23.5 23.3 23.1 22.8 22.4 21.7 21.5 Total number of children (in millions) Age Group Ages 0-5 Children as a Percentage of the Total Population 1 Population projection estimates are based on the Census 2010 counts. Sources: Federal Interagency Forum on Child and Family Statistics. (2015) America's Children: Key National Indicators of Well-Being, 2015, Tables POP1 and POP2. Federal Interagency Forum on Child and Family Statistics, Washington, DC: U.S. Government Printing Office. Available at: http://childstats.gov/americaschildren/tables.asp 6


