Do You Take Your Dashboard at Face Value?
advertisement
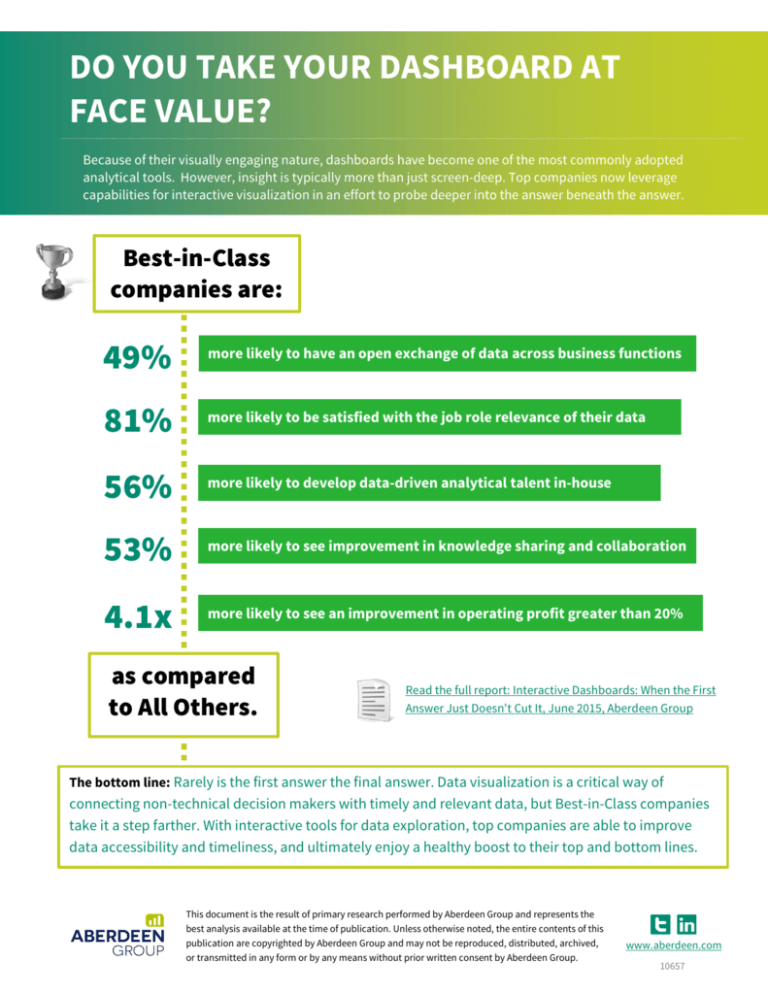
DO YOU TAKE YOUR DASHBOARD AT FACE VALUE? Because of their visually engaging nature, dashboards have become one of the most commonly adopted analytical tools. However, insight is typically more than just screen-deep. Top companies now leverage capabilities for interactive visualization in an effort to probe deeper into the answer beneath the answer. Best-in-Class companies are: 49% more likely to have an open exchange of data across business functions 81% more likely to be satisfied with the job role relevance of their data 56% more likely to develop data-driven analytical talent in-house 53% more likely to see improvement in knowledge sharing and collaboration 4.1x more likely to see an improvement in operating profit greater than 20% as compared to All Others. Read the full report: Interactive Dashboards: When the First Answer Just Doesn't Cut It, June 2015, Aberdeen Group The bottom line: Rarely is the first answer the final answer. Data visualization is a critical way of connecting non-technical decision makers with timely and relevant data, but Best-in-Class companies take it a step farther. With interactive tools for data exploration, top companies are able to improve data accessibility and timeliness, and ultimately enjoy a healthy boost to their top and bottom lines. This document is the result of primary research performed by Aberdeen Group and represents the best analysis available at the time of publication. Unless otherwise noted, the entire contents of this publication are copyrighted by Aberdeen Group and may not be reproduced, distributed, archived, or transmitted in any form or by any means without prior written consent by Aberdeen Group. www.aberdeen.com 10657


