Elementary Statistics
advertisement
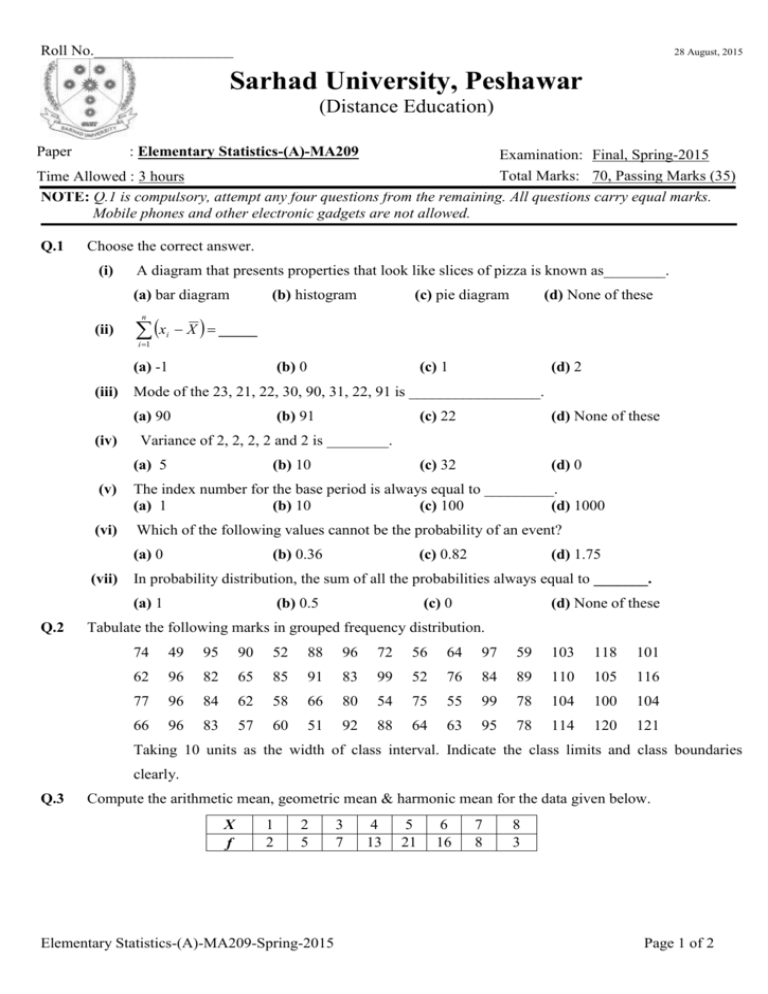
Roll No.__________________ 28 August, 2015 Sarhad University, Peshawar (Distance Education) Paper : Elementary Statistics-(A)-MA209 Examination: Final, Spring-2015 Total Marks: 70, Passing Marks (35) Time Allowed : 3 hours NOTE: Q.1 is compulsory, attempt any four questions from the remaining. All questions carry equal marks. Mobile phones and other electronic gadgets are not allowed. Q.1 Choose the correct answer. (i) A diagram that presents properties that look like slices of pizza is known as________. (a) bar diagram x n (ii) i 1 i (b) histogram (c) pie diagram (d) None of these X _____ (a) -1 (b) 0 (c) 1 (d) 2 (iii) Mode of the 23, 21, 22, 30, 90, 31, 22, 91 is _________________. (a) 90 (iv) (b) 91 (d) None of these (c) 32 (d) 0 Variance of 2, 2, 2, 2 and 2 is ________. (a) 5 (b) 10 (v) The index number for the base period is always equal to _________. (a) 1 (b) 10 (c) 100 (d) 1000 (vi) Which of the following values cannot be the probability of an event? (a) 0 (vii) (b) 0.36 (c) 0.82 (d) 1.75 In probability distribution, the sum of all the probabilities always equal to _______. (a) 1 Q.2 (c) 22 (b) 0.5 (c) 0 (d) None of these Tabulate the following marks in grouped frequency distribution. 74 49 95 90 52 88 96 72 56 64 97 59 103 118 101 62 96 82 65 85 91 83 99 52 76 84 89 110 105 116 77 96 84 62 58 66 80 54 75 55 99 78 104 100 104 66 96 83 57 60 51 92 88 64 63 95 78 114 120 121 Taking 10 units as the width of class interval. Indicate the class limits and class boundaries clearly. Q.3 Compute the arithmetic mean, geometric mean & harmonic mean for the data given below. X f 1 2 2 5 Elementary Statistics-(A)-MA209-Spring-2015 3 7 4 13 5 21 6 16 7 8 8 3 Page 1 of 2 Roll No.__________________ 28 August, 2015 Q.4 Two candidates X and Y at BBA (Hons) examination obtained the following marks in ten papers. Which of the candidate showed a more consistent performance? Paper X Y Q.5 I 58 39 III 76 86 IV 80 72 V 47 75 VI 72 69 VII 61 57 VIII 59 49 IX 77 83 X 48 66 Compute the consumer price index number for 2014 on the basis of 2010 from the following data, using (i) Aggregative Expenditure Method and (ii) the Household Budget Method. Rice Quantity consumed in 2010 (Qo) 30 Prices in 2010 (Po) 45 Prices in 2014 (Pn) 60 Wheat 30 18 32 Gram 5 60 90 Sugar 5 35 55 Ghee 20 65 100 Commodity Q.6 II 49 38 a) If a card is drawn from an ordinary deck of 52 playing cards, find the probability that (i) the card is a black card, (ii) the card is a 10 b) In a single throw of two fair dice, find the probability that the product of the numbers on the dice is (i) between 8 and 16. Q.7 a) b) Find the value of k so that the function f x defined as follows, may be a density function f ( x) k x 2 , 0 x 1 0, elsewhere Let X has the following probability distribution xi f xi Q.8 a) 1 2 3 4 0.10 0.20 0.20 0.25 5 6 0.15 0.10 Find E(X). In the production of transistors, it is found that 25% of them are defective. If 8 transistors are selected at random from a day’s production, what is the probability that 3 of them are defective? b) If X is a Poisson random variable with parameter 2, find the probabilities for x 0 & 1. Elementary Statistics-(A)-MA209-Spring-2015 Page 2 of 2


