U.S. Cattle Statistics - Iowa Beef Industry Council
advertisement
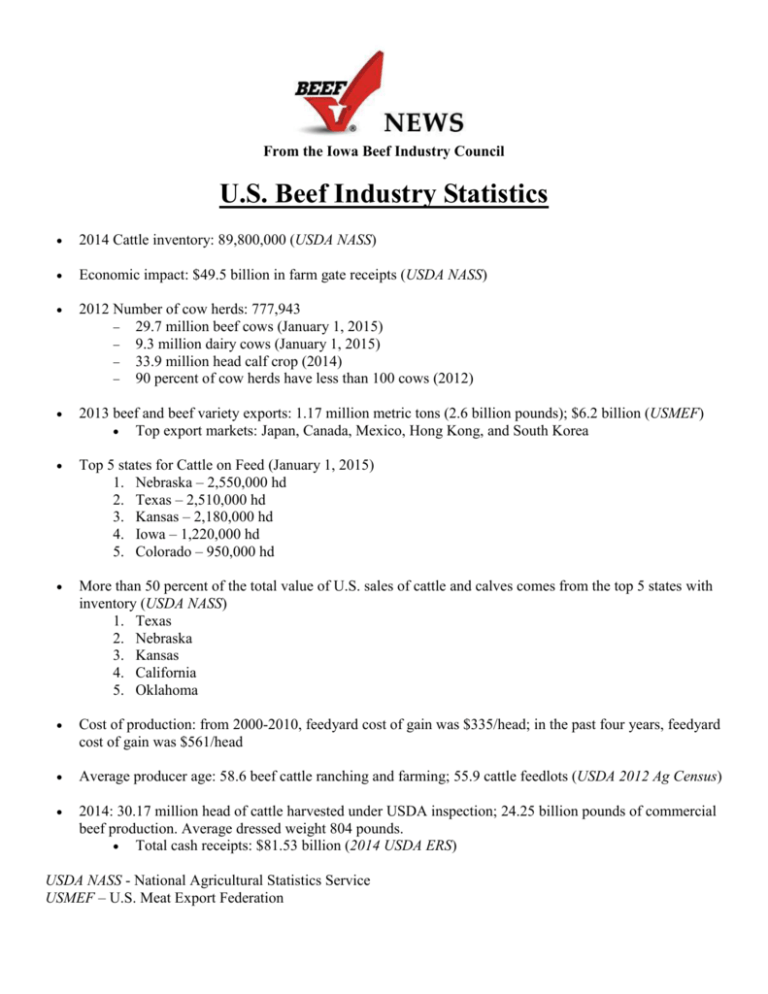
From the Iowa Beef Industry Council U.S. Beef Industry Statistics 2014 Cattle inventory: 89,800,000 (USDA NASS) Economic impact: $49.5 billion in farm gate receipts (USDA NASS) 2012 Number of cow herds: 777,943 29.7 million beef cows (January 1, 2015) 9.3 million dairy cows (January 1, 2015) 33.9 million head calf crop (2014) 90 percent of cow herds have less than 100 cows (2012) 2013 beef and beef variety exports: 1.17 million metric tons (2.6 billion pounds); $6.2 billion (USMEF) Top export markets: Japan, Canada, Mexico, Hong Kong, and South Korea Top 5 states for Cattle on Feed (January 1, 2015) 1. Nebraska – 2,550,000 hd 2. Texas – 2,510,000 hd 3. Kansas – 2,180,000 hd 4. Iowa – 1,220,000 hd 5. Colorado – 950,000 hd More than 50 percent of the total value of U.S. sales of cattle and calves comes from the top 5 states with inventory (USDA NASS) 1. Texas 2. Nebraska 3. Kansas 4. California 5. Oklahoma Cost of production: from 2000-2010, feedyard cost of gain was $335/head; in the past four years, feedyard cost of gain was $561/head Average producer age: 58.6 beef cattle ranching and farming; 55.9 cattle feedlots (USDA 2012 Ag Census) 2014: 30.17 million head of cattle harvested under USDA inspection; 24.25 billion pounds of commercial beef production. Average dressed weight 804 pounds. Total cash receipts: $81.53 billion (2014 USDA ERS) USDA NASS - National Agricultural Statistics Service USMEF – U.S. Meat Export Federation


