Aquarium Ecosystem – NetLogo Questions running Fish Spawn
advertisement
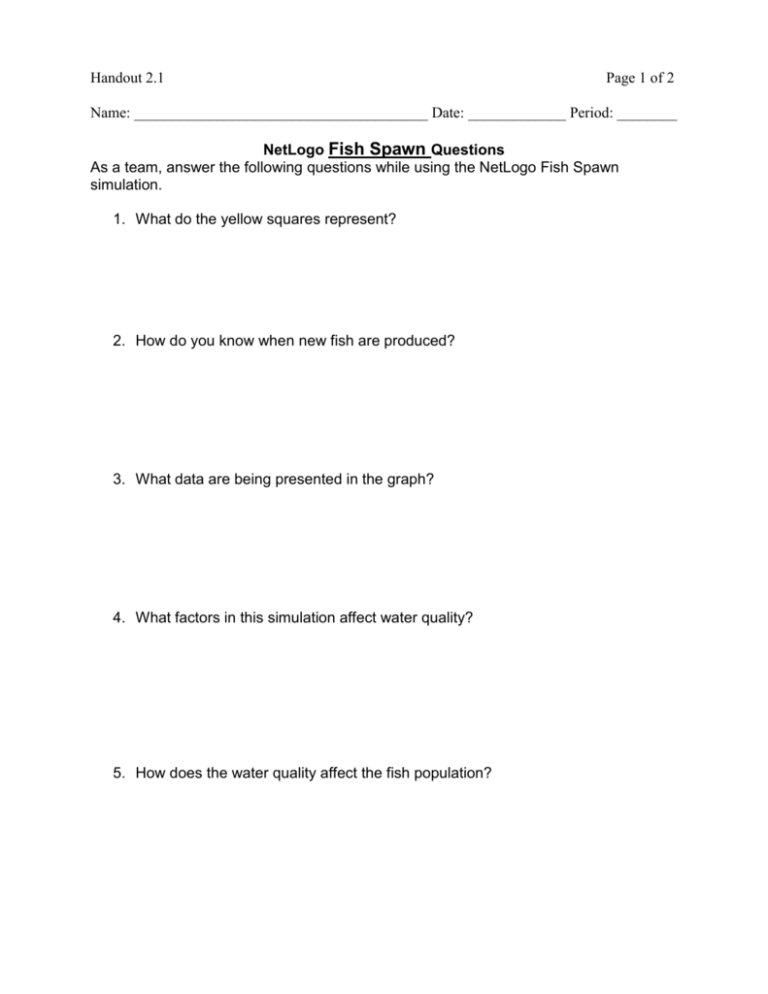
Handout 2.1 Page 1 of 2 Name: _______________________________________ Date: _____________ Period: ________ NetLogo Fish Spawn Questions As a team, answer the following questions while using the NetLogo Fish Spawn simulation. 1. What do the yellow squares represent? 2. How do you know when new fish are produced? 3. What data are being presented in the graph? 4. What factors in this simulation affect water quality? 5. How does the water quality affect the fish population? Handout 2.1 Page 2 of 2 6. What factors affect the number of fish spawned? 7. What is the fastest way to improve water quality? 8. What factors create a situation where fish die mostly because of old age? 9. What factors appear the most important to keeping the fish alive and reproducing?


