Supplementary Information (doc 58K)
advertisement
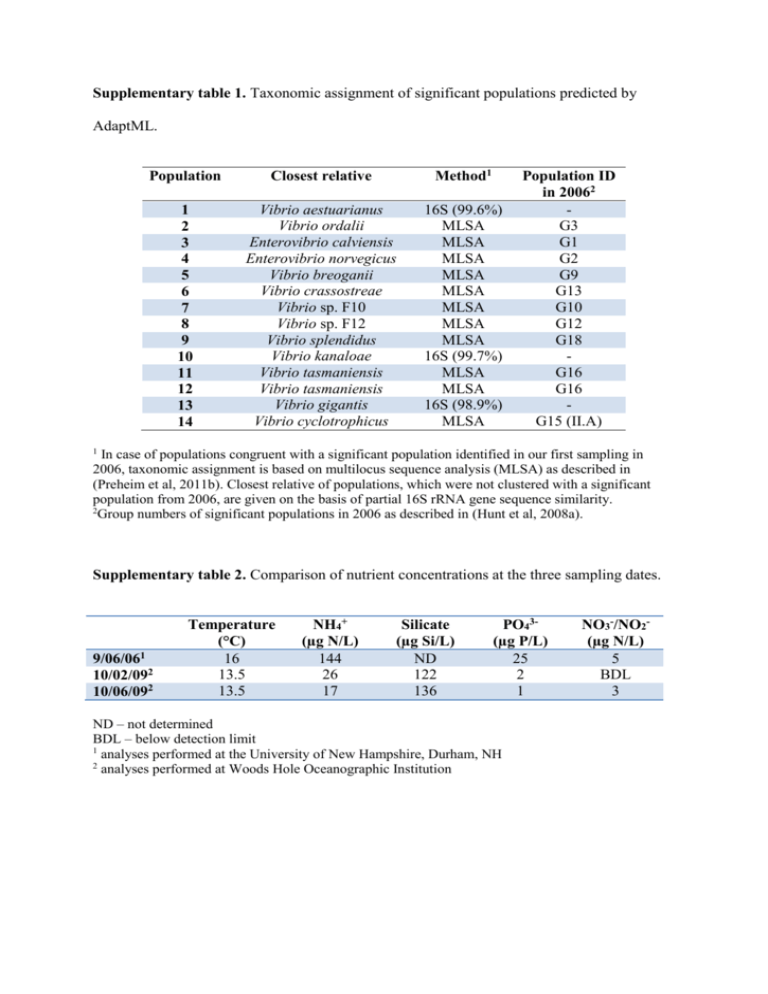
Supplementary table 1. Taxonomic assignment of significant populations predicted by AdaptML. Population Closest relative Method1 1 2 3 4 5 6 7 8 9 10 11 12 13 14 Vibrio aestuarianus Vibrio ordalii Enterovibrio calviensis Enterovibrio norvegicus Vibrio breoganii Vibrio crassostreae Vibrio sp. F10 Vibrio sp. F12 Vibrio splendidus Vibrio kanaloae Vibrio tasmaniensis Vibrio tasmaniensis Vibrio gigantis Vibrio cyclotrophicus 16S (99.6%) MLSA MLSA MLSA MLSA MLSA MLSA MLSA MLSA 16S (99.7%) MLSA MLSA 16S (98.9%) MLSA Population ID in 20062 G3 G1 G2 G9 G13 G10 G12 G18 G16 G16 G15 (II.A) 1 In case of populations congruent with a significant population identified in our first sampling in 2006, taxonomic assignment is based on multilocus sequence analysis (MLSA) as described in (Preheim et al, 2011b). Closest relative of populations, which were not clustered with a significant population from 2006, are given on the basis of partial 16S rRNA gene sequence similarity. 2 Group numbers of significant populations in 2006 as described in (Hunt et al, 2008a). Supplementary table 2. Comparison of nutrient concentrations at the three sampling dates. 9/06/061 10/02/092 10/06/092 Temperature (°C) 16 13.5 13.5 NH4+ (µg N/L) 144 26 17 Silicate (µg Si/L) ND 122 136 PO43(µg P/L) 25 2 1 ND – not determined BDL – below detection limit 1 analyses performed at the University of New Hampshire, Durham, NH 2 analyses performed at Woods Hole Oceanographic Institution NO3-/NO2(µg N/L) 5 BDL 3
