3rd grade reading common assessment
advertisement
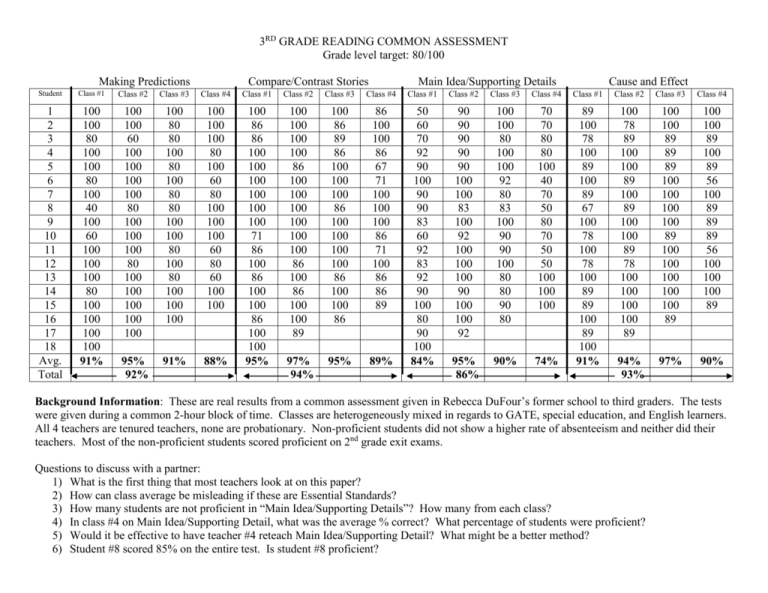
3RD GRADE READING COMMON ASSESSMENT Grade level target: 80/100 Making Predictions Compare/Contrast Stories Main Idea/Supporting Details Cause and Effect Student Class #1 Class #2 Class #3 Class #4 Class #1 Class #2 Class #3 Class #4 Class #1 Class #2 Class #3 Class #4 Class #1 Class #2 Class #3 Class #4 1 2 3 4 5 6 7 8 9 10 11 12 13 14 15 16 17 18 Avg. Total 100 100 80 100 100 80 100 40 100 60 100 100 100 80 100 100 100 100 91% 100 100 60 100 100 100 100 80 100 100 100 80 100 100 100 100 100 100 80 80 100 80 100 80 80 100 100 80 100 80 100 100 100 100 100 100 80 100 60 80 100 100 100 60 80 60 100 100 100 100 100 100 86 100 100 100 100 100 100 86 100 86 100 100 89 100 86 89 86 100 100 100 86 100 100 100 100 86 100 100 86 86 100 100 86 67 71 100 100 100 86 71 100 86 86 89 100 100 80 100 100 92 80 83 100 90 90 100 80 80 90 80 70 70 80 80 100 40 70 50 80 70 50 50 100 100 100 100 100 89 89 89 100 100 100 100 89 100 100 100 100 100 89 100 100 89 100 89 56 100 89 89 89 56 100 100 100 89 88% 97% 94% 95% 89% 95% 86% 90% 74% 89 100 78 100 89 100 89 67 100 78 100 78 100 89 89 100 89 100 91% 100 78 89 100 100 89 100 89 100 100 89 78 100 100 100 100 89 91% 50 60 70 92 90 100 90 90 83 60 92 83 92 90 100 80 90 100 84% 90 90 90 90 90 100 100 83 100 92 100 100 100 90 100 100 92 95% 92% 100 86 86 100 100 100 100 100 100 71 86 100 86 100 100 86 100 100 95% 94% 93% 97% 90% Background Information: These are real results from a common assessment given in Rebecca DuFour’s former school to third graders. The tests were given during a common 2-hour block of time. Classes are heterogeneously mixed in regards to GATE, special education, and English learners. All 4 teachers are tenured teachers, none are probationary. Non-proficient students did not show a higher rate of absenteeism and neither did their teachers. Most of the non-proficient students scored proficient on 2nd grade exit exams. Questions to discuss with a partner: 1) What is the first thing that most teachers look at on this paper? 2) How can class average be misleading if these are Essential Standards? 3) How many students are not proficient in “Main Idea/Supporting Details”? How many from each class? 4) In class #4 on Main Idea/Supporting Detail, what was the average % correct? What percentage of students were proficient? 5) Would it be effective to have teacher #4 reteach Main Idea/Supporting Detail? What might be a better method? 6) Student #8 scored 85% on the entire test. Is student #8 proficient? 10th Grade English Common Assessment results English 10 team goal: 80% of students master each standard Mr. Jones 10.1 Inferential Reading English10Jones Mastered Not mastered (89%) 63 of 71 Students have mastered this standard 63 89% 8 11% Mastered Not mastered (89%) 562 of 630 students have mastered this standard 562 89% 68 11% Mastered Not mastered (61%) 43 of 71 students have mastered this standard 43 61% 28 39% Mastered Not mastered (73%) 458 of 630 students have mastered this standard 458 73% 172 27% English10Department 10.2 Vocabulary Strategies English10Jones English10Department 10.5 Correctness of Expressions English10Jones Mastered Not mastered English10Department Mastered Not mastered (79%) 56 of 71 students have mastered this standard 56 79% 15 21% (73%) 458 of 630 students have mastered this standard 458 73% 172 27% Background Information: This is real data from a high school. At this school teachers were promised that nobody would ever see another teacher’s data, common assessment data would never be used in evaluations, and team members are encouraged to request help with one standard. Questions to discuss: 1) Which standard will Mr. Jones likely ask for help with? 2) What incentive do the other teachers have to help Mr. Jones address that standard? 3) Did the team meet their goal for standard 10.1? 10.2? 10.5? 4) Does Mr. Jones have to reveal his test scores to ask for help?
