Part A: Analogue
advertisement
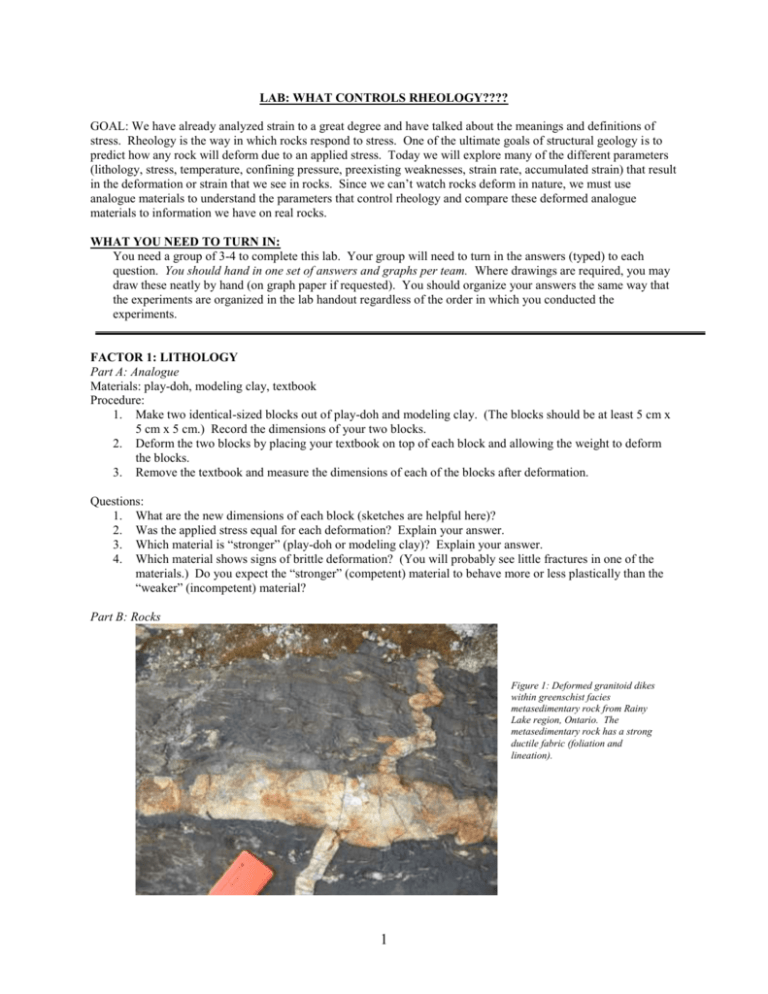
LAB: WHAT CONTROLS RHEOLOGY???? GOAL: We have already analyzed strain to a great degree and have talked about the meanings and definitions of stress. Rheology is the way in which rocks respond to stress. One of the ultimate goals of structural geology is to predict how any rock will deform due to an applied stress. Today we will explore many of the different parameters (lithology, stress, temperature, confining pressure, preexisting weaknesses, strain rate, accumulated strain) that result in the deformation or strain that we see in rocks. Since we can’t watch rocks deform in nature, we must use analogue materials to understand the parameters that control rheology and compare these deformed analogue materials to information we have on real rocks. WHAT YOU NEED TO TURN IN: You need a group of 3-4 to complete this lab. Your group will need to turn in the answers (typed) to each question. You should hand in one set of answers and graphs per team. Where drawings are required, you may draw these neatly by hand (on graph paper if requested). You should organize your answers the same way that the experiments are organized in the lab handout regardless of the order in which you conducted the experiments. FACTOR 1: LITHOLOGY Part A: Analogue Materials: play-doh, modeling clay, textbook Procedure: 1. Make two identical-sized blocks out of play-doh and modeling clay. (The blocks should be at least 5 cm x 5 cm x 5 cm.) Record the dimensions of your two blocks. 2. Deform the two blocks by placing your textbook on top of each block and allowing the weight to deform the blocks. 3. Remove the textbook and measure the dimensions of each of the blocks after deformation. Questions: 1. What are the new dimensions of each block (sketches are helpful here)? 2. Was the applied stress equal for each deformation? Explain your answer. 3. Which material is “stronger” (play-doh or modeling clay)? Explain your answer. 4. Which material shows signs of brittle deformation? (You will probably see little fractures in one of the materials.) Do you expect the “stronger” (competent) material to behave more or less plastically than the “weaker” (incompetent) material? Part B: Rocks Figure 1: Deformed granitoid dikes within greenschist facies metasedimentary rock from Rainy Lake region, Ontario. The metasedimentary rock has a strong ductile fabric (foliation and lineation). 1 Questions: 1. Figure 1 shows a competent rock and an incompetent rock. Which is which? How can you tell? (Hint: think about which shows evidence for brittle deformation and compare this to the analogue experiment above.) 2. In figure 1, the granitoid dikes are both boudinaged and folded. How could both occur within the same deformation? (Hint: think back to the lab you did on strain!) 3. There are several fractures within the boudinaged portion of the dike. In general, how are these fractures oriented? Do the fractures indicate the orientation of stress or strain? FACTOR 2: STRESS Part A: Analogue 1 Materials: play-doh, textbook, pencil, ruler. Procedure: 1. Make 2 identical towers of play-doh (10 cm tall, 5 cm wide, and 5 cm long). Measure and record all dimensions of the towers. 2. Carefully balance the weight of your textbook onto one of the towers so that the weight of the book causes the play-doh to deform. 3. Put the eraser end of the pencil on top of the second play-doh tower. Now, carefully balance the weight of the textbook on top of the pencil so that the weight of the book causes the play-doh to deform. (Yes, this is tricky, but use your hands to carefully guide the book without supporting its weight). Questions: 1. Choose the material line that has undergone the most shortening during deformation for each experiment. Calculate the percent shortening for that material line. 2. Calculate the force of each deformation (ignore the weight of the pencil and assume that your book weighs about 2 lbs or 907 g- use metric units). 3. Calculate the stress of each deformation. 4. What can you conclude, from the two experiments, about the effect of increasing stress on the resulting deformation? Part A: Analogue 2 Materials: “spring” from a notebook Procedure: 1. Like the last analogue experiment, we will conduct two similar experiments. Unlike the last experiment, we will vary the stress between the two experiments by keeping the same area, but increasing the applied force. 2. Measure and record the length of the springs. 3. Using a very small force, pull the spring apart enough so that it will change length, but bounce back to its original length when you release the force. Measure the length of the spring before you release it. 4. Now, using a slightly larger force, pull the spring apart so that it will permanently change length. Measure the length of the spring after deformation. Questions: 1. Which experiment (first or second) had a higher stress? 2. Which experiment(s) (first or second) had elastic deformation? Plastic deformation? Part B: Rocks Questions: 1. Look at Figure 2. Draw this plot on your answer sheet and mark the yield strength, ultimate strength, and rupture. Indicate which parts of the curve represent elastic strain and which represent plastic strain. 2. From your experiment with the springs, you noticed that by increasing the stress, you caused plastic strain to occur rather than only elastic strain (if not, think through that experiment again). Does this mean that by increasing stress, more plastic strain occurs in rocks? Use the schematic plot above to explain your answer. 2 Percent Strain Figure 2: Schematic plot of a rock deformation experiment. FACTOR 3: TEMPERATURE Part A Analogue: Materials: 2 sticks of butter: one room temperature and one refrigerated Procedure: So as not to waste too much butter, we will conduct this experiment together. 1. Slightly open the warm butter package and slowly fold it with your hands. 2. Slightly open the cold butter package and slowly fold it with your hands. Questions: 1. Based on your observations, is an increase in temperature more likely to cause materials to strain plastically or elastically? 2. Based on your observations, is an increase in temperature more likely to cause materials to have brittle or ductile deformation? 3. Where did you see fractures in the cold butter? (Explain the orientation- a sketch will make this easier.) 4. Where did you see fractures in the warm butter? (Explain the orientation- a sketch will make this easier.) 5. Consider what you know about deformation in another common household food, chocolate. Do all materials behave plastically at the same temperature? Part B: Griggs et al. deformation experiment for basalt under various temperatures Figure 3: Stress-strain diagram for basalt deformed at 5 kbar confining pressure under a variety of temperature conditions. From Griggs, Turner, and Heard (1960). Graph copied from Davis and Reynolds (1996). Questions: 1. Review Figure 3. Under what temperature is the basalt “strongest?” 3 2. 3. Give the strain at which the basalt ruptured for each temperature experiment. What was the stess at which the basalt at 25°, 300°, 500°, 700°, and 800° ruptured? Describe the general trend. What factors do you think might make this general trend an imperfect relationship? FACTOR 4: CONFINING PRESSURE Part A Analogue: Materials: wooden fault blocks, 3 heavy textbooks Procedure: 1. Set the fault blocks so that you can simulate strike-slip faulting (to do this, the bedding and the fault will be vertical). 2. Move the fault blocks in a strike-slip fashion. 3. Reset the fault blocks to their undeformed position. Place one of your heavy textbooks on top of the block and move the blocks in a strike-slip fashion. 4. Reset the fault blocks to their undeformed position. Place two of your heavy textbooks on top of the block and move the blocks in a strike-slip fashion. 5. Reset the fault blocks to their undeformed position. Place three of your heavy textbooks on top of the block and move the blocks in a strike-slip fashion. Questions: 1. Describe the change in the experiment as you increased the number of textbooks on top of the fault blocks. 2. What you observed in this experiment was the result of changing the confining pressure. In nature, the confining pressure of deformation increases with depth into the earth. Do you predict that rocks are stronger (hold up against deformation) or weaker (deform easily) at depth? Part B: Donath’s experiments for rocks under various confining pressures Figure 4 is from a famous experiment by Fred Donath. It shows specimens of limestone that were deformed to approximately the same total strain (15%) at different confining pressures. Figure 4: Specimens of limestone deformed to approximately the same total strain (about 15%) at different confining pressures. Increased confining pressure causes a transition fin deformational mode from brittle to ductile faulting. From Donath (1970). Figure copied from Davis and Reynolds (1996). Figure 5 is also from Donath’s experiment. It shows a graph between the differential stress and strain for the limestone deformation experiment (specimens shown above). Questions: 1. Is it possible to strain the rock to 5% at any of the confining pressures shown? How about 15%? 2. At what confining pressure is the rock “strongest?” 3. At what confining pressure is there more ductile deformation? 4 Figure 5: Stress-strain diagrams for limestone deformed at a variety of confining pressures. Tests conducted at room temperature. The magnitude of confining pressure (in MPa) for each run is shown next to each curve. Both strength and plasticity increase with greater confining pressure. From Donath (1970). Figure copied from Davis and Reynolds (1996). FACTOR 5: PREEXISTING WEAKNESSES Part A: Analogue Materials: plastic bags, scissors Procedure: 1. Cut two strips of plastic bag (approximate dimension 5 cm x 15 cm) 2. In one of the strips, at the half-way point, make a small cut partially through the strip. 3. SLOWLY stretch each of the strips until they break. 4. Measure the final length of the plastic bag pieces. Questions: 1. What is the overall stretch of each plastic bag strip prior to rupture? 2. How do you expect preexisting weaknesses to affect the strength of rocks? The localization of structures? Part B: Rocks Figure 6:A) Famous McConnell Thrust Fault in Alberta. B) Carol Ormand points out the McConnell up close. Questions: 1. Thrust faults such as the McConnell (shown above) often follow distinctive weaknesses in the rock. What do you think is the preexisting weakness? FACTOR 6: STRAIN RATE Part A: Analogue experiment Materials: silly putty Procedure 1. Roll the silly putty into a small sausage shape. 5 2. 3. 4. Pull QUICKLY on the silly putty and watch it deform. Roll the silly putty into a small sausage shape. Pull SLOWLY on the silly putty and watch it deform. Questions: 1. Does a slower strain rate favor plastic or elastic deformation? 2. Does the prevalence of lovely ductile deformation structures (such as shear zones) at depth within deformed regions of the crust suggest that strain rates within the earth are typically fast or slow? Part B: Yule Marble deformation experiments Review Figure 7. Questions: 1. Are rocks “stronger” or “weaker” at faster strain rates? Explain your answer. 2. Under the same stress, would you expect to measure more strain (such as in a deformed belemnite) at higher or lower strain rates? Figure 7: Stress-strain diagram for Yule marble deformed at different strain rate conditions. After Heard (1963). Figure copied from Davis and Reynolds (1996). FACTOR 7: ACCUMULATED STRAIN Part A: Analogue Materials: 6-pack plastic strips 6 Procedure: 1. SLOWLY pull on the 6-pack plastic strip. Observe deformation. You experienced 2 changes in the strain with increasing deformation. First, you noticed that the plastic began thinning. This is known as “necking” due to strain softening. At some point, the plastic became more difficult to pull apart again. This is known as “strain hardening.” The same changes happen in rocks. Questions: 1. Ooh and ah appropriately. SYNTHESIS Once you have completed all of the analogue experiments and answered the associated questions, consider some of the ramifications of your work. 1. 2. You looked at seven parameters that may affect rheology. Explain any other factors that may also influence rheology (Hint: your textbook may help). Now, using all of the parameters discussed in this lab, consider a continental collision zone. Write several paragraphs describing the deformation conditions and structures prevalent in different levels of the crust (you may choose to divide the crust into the 1. upper and 2. mid-lower crust). Be sure to refer to all of the parameters you explored in this lab, explain whether you would expect ductile or brittle deformation, and suggest possible types of structures (e.g. faults, folds, shear zones) that may form. References: Davis, G. H., and Reynolds, S. J. 1996. Structural Geology of Rocks and Regions, 2nd edition. New York: John Wiley & Sons, p. 132-137. Donath, F. A., 1970. Some information squeezed out of rock. American Scientist 58, 54-72. Griggs, D. T., Turner, F. J., and Heard, H. C., 1960. Deformation of rocks at 500° to 800° C, in Griggs, D. T., and Handin, J. (eds.), Rock deformation: Geological Society of America Memoir 79, 39-104. Heard, H. C., 1963. Effect of large changes in strain rate in the experimental deformation of Yule marble. Journal of Geology 71, 162-195. 7
