Acoustics Review
advertisement

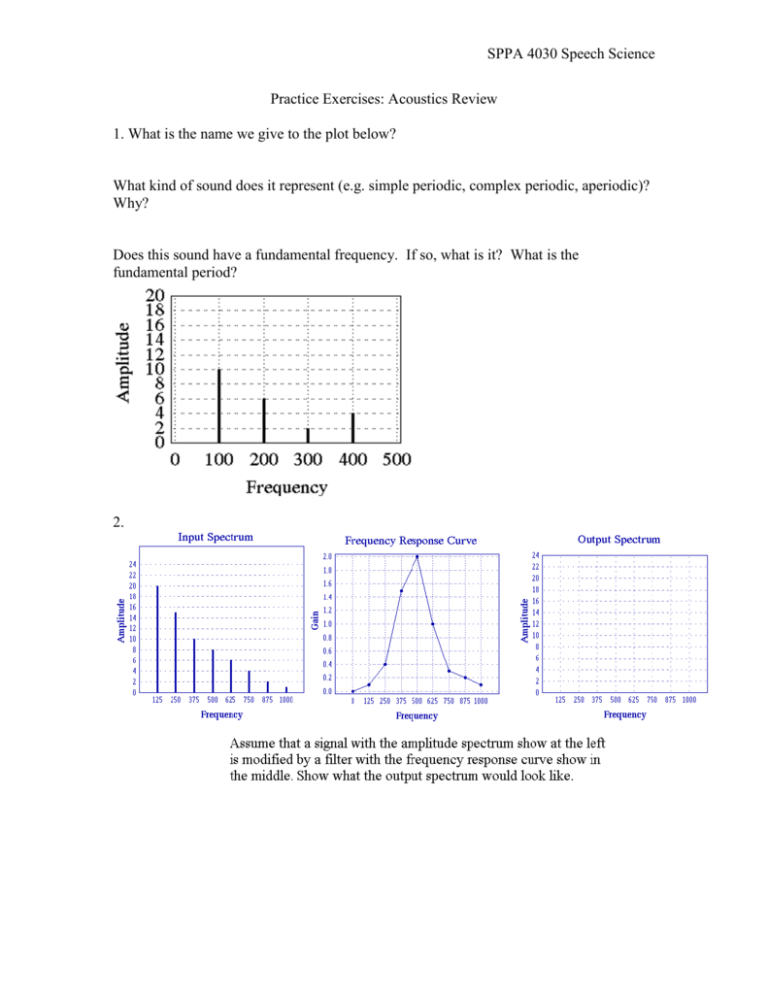
SPPA 4030 Speech Science Practice Exercises: Acoustics Review 1. What is the name we give to the plot below? What kind of sound does it represent (e.g. simple periodic, complex periodic, aperiodic)? Why? Does this sound have a fundamental frequency. If so, what is it? What is the fundamental period? 2. SPPA 4030 Speech Science 3. On the plot below, draw a line that represents the envelope associated with this sound. Is this a spectrum envelope or an amplitude envelope? How do you know? 4. Draw a frequency response curve for the following filters. a. High pass filter with cutoff frequency of 100 Hz. b. Low-pass filter with a cutoff frequency of 500 Hz. c. Band-pass filter with a lower cutoff frequency of 200 Hz and an upper cutoff frequency of 800 Hz. 5. You have a client who has a vocal fold paralysis. As a result of this disorder, his speech is extremely soft. One of your therapeutic goals is to increase the client’s loudness of speech. You measure the average sound pressure level of the clients speech before and after your therapy. Pre-therapy sound pressure level was 11 pressure units (actual units doesn’t matter). Post-therapy sound pressure level was 23 pressure units. Calculate the increase in sound pressure level in decibels. 6. Express the following pressures in dBSPL with respect to the following reference pressure. PREF 20 micropascals a. 200 micropascals b. 10000 micropascals c. 20000 micropascals d. 200000 micropascals e. 2 micropascals f. 1 micropascal 7. A group of Parkinson’s patients were found to speak with an average sound pressure level of 12,000 micropascals. A group of healthy speakers spoke with an average sound pressure level of 20,000 micropascals. Express, in decibels, the difference in sound pressure level between Parkinsons’ group and the healthy control group. SPPA 4030 Speech Science 8. For these six plots, provide the name we give to this graph type, describe what type of sound the plot represents and match those plots that are plotting similar types of sounds. SPPA 4030 Speech Science 9. a. Draw an amplitude spectrum of a sound that has the same harmonic structure as the sound below, but has a different spectrum envelope. b. Draw an amplitude spectrum of a sound that has the same spectrum envelope as the sound below, but has a different harmonic structure. 10. You measure air pressure in your mouth during speech to be 5 cm H2O above atmosphere. Is this pressure measure a vector or scalar value? Why? 11. Draw a pressure waveform for a sinusoid that has a frequency of 200 Hz and a peak pressure of +/- 100 micropascals. Label axes with units and a number scale. 12. Draw an amplitude spectrum for a sinusoid that has a period of 10 milliseconds and a peak pressure of +/- 50 micropascals. Label axes with units and a number scale. 13. A 30 year old singer comes to see you complaining of problems producing a high notes when singing. Her speaking voice sounds normal. You record her producing a sustained ‘ah’. Looking at the waveform of the sustained ‘ah’, you measure the fundamental period to be 5.8 milliseconds. a. Based on our discussions in class, what kind of waveform would you expect it to be (simple periodic, complex periodic, aperiodic)? b. To your best ability draw an amplitude spectrum for the pressure waveform associated with her /ah/ production. Use any resources available (textbook, class notes, internet) to help you. Label axes with units and a number scale. 14. What would be the wavelength of a sinusoid with a frequency of 290 Hz? Speed of sound= 35000 cm/sec 15. Draw and label and amplitude spectrum for the following sounds. If specific amplitude information is not provided, use relative values. Use a frequency range of 02000 Hz a. simple periodic sound with fundamental period of 8 msec and peak-to-peak amplitude of 5000 micropascals. SPPA 4030 Speech Science b. complex periodic waveform with a flat spectrum envelope and fundamental frequency of 225 Hz. c. complex periodic waveform with a spectrum envelope that rises with frequency and a fundamental frequency of 400 Hz. d. aperiodic sound that has a spectrum envelope that has a peak at 1500 Hz. e. aperiodic sound with a flat spectrum envelope f. periodic sound with a fundamental frequency of 125 Hz and a spectrum envelope that is similar to the glottal source spectrum 16. Draw an amplitude spectrum for the sound you just drew in part c. of Q 15 except that the fundamental frequency had dropped by 2 octaves. 17. You pass the sound you drew in part b. of Q 15 through the following filters. Draw the input spectrum, frequency response curve and output spectrum for each filter example. a. bandpass filter with center frequency at 400 Hz and lower and upper cutoff frequencies at 100 Hz below and above the center frequency. b. high-pass filter with a cut-off frequency of 600 Hz. c. low-pass filter with a cut-off frequency of 500 Hz. 18. Now pass the sound you drew in part e. of Q 15 through the filters of Q17. Show the output spectra for each. 19. Draw a waveform, amplitude spectrum and phase spectrum for the following. a. sinusoid with frequency of 125 Hz, peak-to-peak amplitude of 10000 micropascals and a phase of 180 degrees. b. simple periodic sound with frequency of 275 Hz, peak-to-peak amplitude of 30000 micropascals and a phase of 90 degrees. 20. Draw a narrowband spectrogram for the following sounds. Use a frequency range of 0-2000 Hz. a. complex periodic sound with a flat spectrum envelope and an unchanging fundamental frequency of 150 Hz that is 3 seconds long. b. complex periodic sound with a flat spectrum envelope and a fundamental frequency that begins at 100 Hz and gradually rises over a duration of 3 seconds to 300 Hz. c. aperiodic sound with a flat spectrum envelope that is 2 seconds in duration. 21. Draw a wide-band spectrogram for an unchanging sound 5 second long and with a spectrum envelope that has equal amplitude peaks at 500 Hz, 1500 Hz and 2500 Hz. 22. Draw the amplitude spectrum of a quasi-periodic sound. The periodic component has a fundamental frequency of 200 Hz and the harmonics all have amplitudes of 10000 micopascals. The aperiodic “noise floor” is 5000 micropascals at all frequencies. Use a frequency range from 0-2000 Hz. NOTE: This is more of an ‘advanced question’ to test SPPA 4030 Speech Science your ability to integrate information. We’ll be covering this more in the section on phonation. 23. Below are three different types of plots stacked on each other. Circle the correct answer to the following questions i. Which plot is a wide band spectrogram? A B C ii. Which plot is a sound pressure waveform? A B C iii. Which plot is a narrow band spectrogram? A B C iv. Which plot best shows the harmonic structure of the signal? A B v. Which plot best shows the formant structure of the signal? A B C A B C Time C


