Using East- Analysis of Group Sequential Trials Phase II trials on a
advertisement
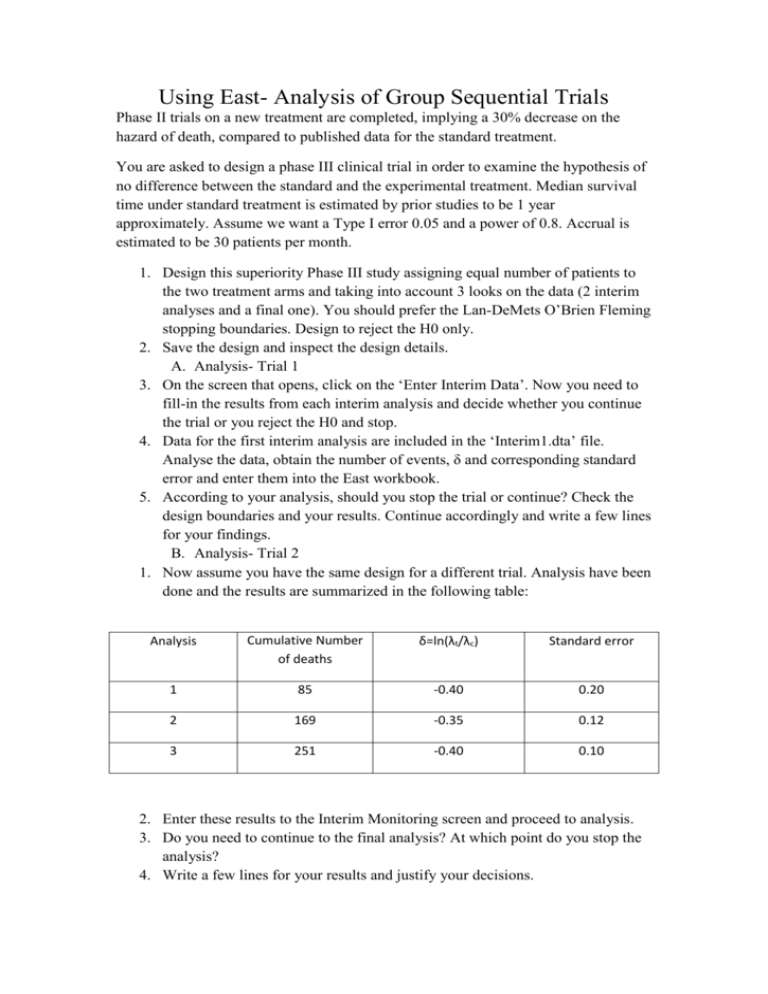
Using East- Analysis of Group Sequential Trials Phase II trials on a new treatment are completed, implying a 30% decrease on the hazard of death, compared to published data for the standard treatment. You are asked to design a phase III clinical trial in order to examine the hypothesis of no difference between the standard and the experimental treatment. Median survival time under standard treatment is estimated by prior studies to be 1 year approximately. Assume we want a Type I error 0.05 and a power of 0.8. Accrual is estimated to be 30 patients per month. 1. Design this superiority Phase III study assigning equal number of patients to the two treatment arms and taking into account 3 looks on the data (2 interim analyses and a final one). You should prefer the Lan-DeMets O’Brien Fleming stopping boundaries. Design to reject the H0 only. 2. Save the design and inspect the design details. A. Analysis- Trial 1 3. On the screen that opens, click on the ‘Enter Interim Data’. Now you need to fill-in the results from each interim analysis and decide whether you continue the trial or you reject the H0 and stop. 4. Data for the first interim analysis are included in the ‘Interim1.dta’ file. Analyse the data, obtain the number of events, δ and corresponding standard error and enter them into the East workbook. 5. According to your analysis, should you stop the trial or continue? Check the design boundaries and your results. Continue accordingly and write a few lines for your findings. B. Analysis- Trial 2 1. Now assume you have the same design for a different trial. Analysis have been done and the results are summarized in the following table: Analysis Cumulative Number of deaths δ=ln(λt/λc) Standard error 1 85 -0.40 0.20 2 169 -0.35 0.12 3 251 -0.40 0.10 2. Enter these results to the Interim Monitoring screen and proceed to analysis. 3. Do you need to continue to the final analysis? At which point do you stop the analysis? 4. Write a few lines for your results and justify your decisions. C. Analysis- Trial 3 1. Now assume you have the same design for a different trial. Analysis have been done and the results are summarized in the following table: Analysis Cumulative Number of deaths δ=ln(λt/λc) Standard error 1 83 -0.10 0.38 2 167 -0.05 0.21 3 251 -0.09 0.10 2. Analyse the trial. Pay special attention to the Conditional Power. The conditional power at each step, gives you the probability of rejecting the Null at the next interim analysis if it is performed at each ideal position and given the test statistics so far. Thus, a very low CP, say below 10%, says that it is very unlike to reject the Null at the next look. 3. Comment on the results. Was the design we used appropriate for this trial? What would you suggest? D. Futility Trials 1. Design the same trial, make the same assumption but this time allow for discontinuation due to futility. To do this, On the tab ‘Boundary info’ select Futility as well as Efficacy. Use Spending functions- Lan DeMets and OF for the H1 rejection boundaries. 2. Inspect the boundaries for rejection, and the corresponding plot. Notice that this time, a rejection region for H1 is generated as well. 3. Assume that the data analysis gave you the same estimate as in the previous question (B). Perform the Interim analysis, entering the results in the ‘Interim Monitoring’ sheet. 4. Inspect the results produced and decide for the continuation/discontinuation of the study at each look. 5. Write a few lines for your findings.
