srep02624-s7
advertisement
SUPPLEMENTARY INFORMATION
For
Label-Free Nanometer-Resolution Imaging of Biological
Architectures through Surface Enhanced Raman Scattering
E-mail: aykutlu@unam.bilkent.edu.tr
A- Spatial Uniformity of the Spontaneously Organized Metasurface (SOM)
and comparison with alternative SERS substrates
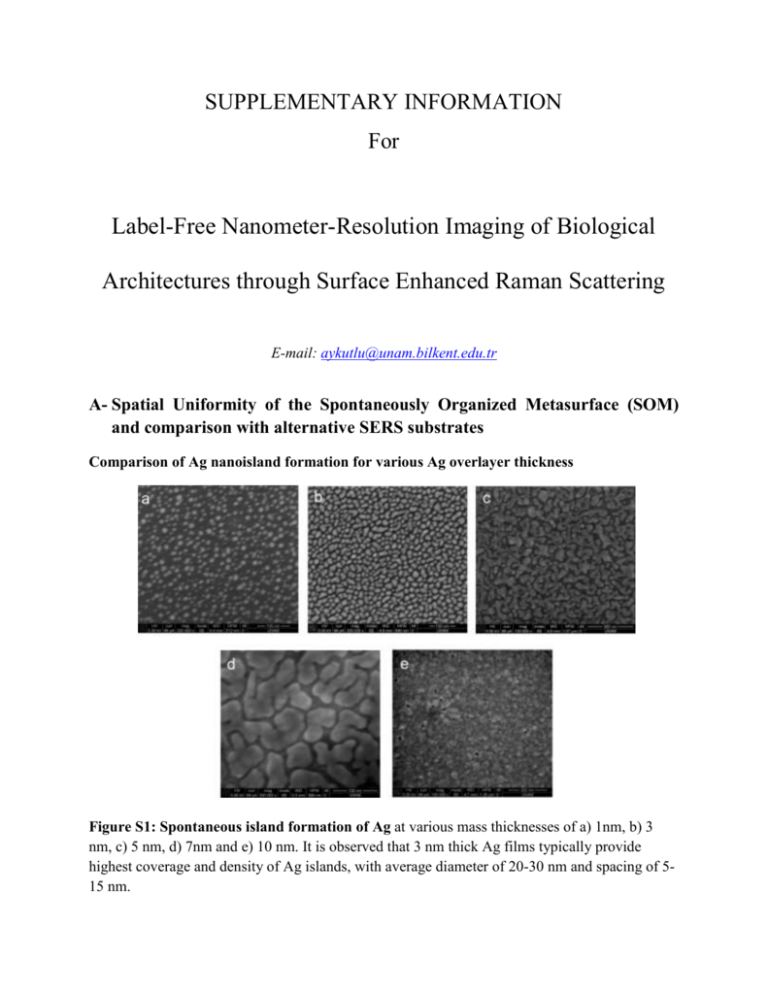
Comparison of Ag nanoisland formation for various Ag overlayer thickness
Figure S1: Spontaneous island formation of Ag at various mass thicknesses of a) 1nm, b) 3
nm, c) 5 nm, d) 7nm and e) 10 nm. It is observed that 3 nm thick Ag films typically provide
highest coverage and density of Ag islands, with average diameter of 20-30 nm and spacing of 515 nm.
Figure S2: Measured Reflectance of Ag Metal-Insulator-Metal surfaces at various mass
thicknesses of a) 1nm, b) 3 nm, c) 5 nm, d) 7 nm and e) 10 nm. It is observed that 3 nm thick Ag
films result in a strong plasmonic absorption band near the Raman excitation wavelength of 532
nm. Three curves (blue, green and red) correspond to insulator thicknesses of 10, 20 and 30 nm.
Layer-by-layer Deposited Ag nanoparticle substrate
Alternating LBL deposited Ag nanoparticles and PAH (Poly(allylamine hydrochloride))
polyelectrolyte multilayers ({PAH/Ag}n) provides an alternative substrate with uniform surface
coverage and high density of SERS hot-spots. The substrate is the LBL assembly of pre-formed 8
nm diameter Ag nanoparticles which are produced by reducing Ag+ ions in the presence of
reducing agents NaBH4 and sodium citrate in the aqueous solution. Fabrication of the LBL
substrate is carried out by sequential dipping of pre-cleaned glass slide in to the aqueous solutions
of positively charged PAH polyelectrolyte and negatively charged citrate capped Ag nanoparticle
solution .
Layer-by-Layer (LBL) deposition provides an alternative substrate with uniform coverage and
high density of SERS hot-spots. The substrates are fabricated on glass substrates by multiple
layer deposition of 8 nm diameter Ag nanoparticles (Figure S1). The aim of comparing the SOM
with the LBL substrate is to show that, although LBL results in uniform surface coverage,
enhancement factor uniformity is inferior to SOM due to the highly random nature of the
production process of LBL. Also, the presence of polymer layers in the LBL surfaces produces
spurious SERS signals without external introduction of a probe molecule or organic
nanostructure.
Figure S3. Description of the Layer-by-Layer deposited Ag nanoparticle surface. (a)
Alternating layers of silver nanoparticles and PAH are deposited by dip coating pre-cleaned glass
slides. (b) Representative Transmission Electron Micrograph (TEM) of Ag nanoparticles and (c)
size histogram extracted from TEM data. (d) Optical absorbance of samples with one, two, three
and four layers of Ag nanoparticles is shown. As the number of layers increase, a broad shoulder
towards 600 nm appears, indicating presence of plasmonic resonances due to inter-particle
effects.
Nanosphere lithography SERS substrate
Nanosphere lithography (NSL) has been previously used to fabricate nanodot arrays for SERS
and other plasmonic sensing applications. Here, we use NSL to fabricate metal-insulator-metal
(MIM) sandwitch structures (Fig. S2). The structures are fabricated on silver-on-glass substrates,
using 1000 nm and 500 nm polymer spheres. The advantage of the MIM structure is the ease of
tunability of the resonance wavelength. Although commonly used for SERS analysis, the NSL
substrate features a well-ordered periodic surface with typical periodicity on the order of
diffraction limited spot size, therefore not appropriate for super-resolution imaging using the
SERS signal.
Figure S4. (a) Schematic representation of a sub-unit of plasmonic structures fabricated by
nanosphere lithography (NSL). Typical dimensions are 0.25 to 1 um diameter for the
nanospheres, 20 nm thickness for the top Ag layer, 10-20 nm for the intermediate dielectric
(Al2O3) and 20 nm for the bottom Ag layer. (b) Representative scanning electron micrograph of
the surfaces show a region with several fabrication defects. (Scale bar 500 nm). (c) Hexagonal
lattice of the NSL surface can be resolved in bright field optical micrographs of the surfaces.
Figure S5. Comparison of uniformity of three SERS substrates. (a) Confocal Raman maps
are recorded using different excitation power levels for the SOM to investigate spatial uniformity.
(b) Confocal Raman maps on the layer-by-layer deposited Ag substrate display a non-uniform
spatial distribution of hot-spots. (c) Confocal Raman map recorded on the plasmonic surface
fabricated using nanosphere lithography exhibits spatially non-uniform enhancement, due to
inherently structured surface as well as due to fabrication non-uniformity. All scale bars are 1µm
wide. (d) Intensity histograms show that Raman enhancement on SOM is spatially uniform and
features a Gaussian-like distribution with a mean and variance that depends on excitation power.
(e) Intensity histograms of layer-by-layer deposited surface show a log-normal distribution due to
non-uniformity of enhancement factors of hot spots. Nanosphere lithography surfaces also
display a log-normal distribution (data not shown).
B- Self-assembled peptide nanofibers
Figure S6. Description of peptides and their self-assembled nanofibers. Chemical
representation of AIP-1 (a) and AIP-2 (b) peptides. (c) TEM images of AIP-1+2 nanofibers (scale
bar 20 nm). (d) Atomic force microscope topography image of AIP-1+2 peptide nanofibers using
a clean silicon surface as the substrate. The image shows presence of residual peptide coverage
on the surface as well as individual self-assembled fibers.
C- Temporal Characteristics of Blinking and evidence for light-induced blink
rate
Figure S7. (a) Time-series of Raman spectra recorded on a peptide saturated SOM using spot
illumination. (b) Spectrally Integrated Raman intensity (500-3500 cm-1) recorded on the SERS
substrate using the spectrometer with 30 msec integration time shows fluctuations limited by the
measurement bandwidth. (c) When the Raman signal is measured using a photomultiplier (output
is filtered using 400 µsec integration time), fluctuations are observed to persist at finer
timescales. (d) Raw output from the photomultiplier (10 nsec rise time) shows blinking events
exhibit features at timescales below 1 µsec. (e) Blinking rate areal density is extracted from a
video sequence recorded under wide-field illumination at 14 frames per second. A linear
dependence of the blinking rate on excitation power density confirms that light induced
secondary effects are effective in the blinking behavior. (f) Average spot intensity extracted from
the video sequence also shows a linear dependence on excitation power density. Red dotted lines
are linear fits to guide the eye.
D- Stochastic Reconstruction image of imprinted peptide layers
Wide field SERS imaging has been performed using a 100x 0.95NA objective, and the field
of view of the CCD camera was 64 µm wide. However, for stochastic reconstruction,
typically a smaller field of view was used. The laser that was used to illuminate the sample
could be defocused to an area that has a spot diameter of up to 50 µm, filling the field of
view. Typically, a smaller area with diameter of 20 µm was illuminated. Scale bars are shown
on images to show the size of imaging area.
Figure S8: (a) Under wide field illumination (with 10mW illumination over a 15 µm diameter
spot), uniformly distributed blinking spots can be observed on the SOM saturated with a peptide
layer. (scale bar 3 µm). (b) Stochastic reconstruction is performed on the data shown in (a). A
uniform distribution of blinking spots result in an image with no distinct identifiable features
(scale bar 2 µm). (c) Stochastic reconstruction applied to an image sequence recorded on
imprinted peptide layers is shown (scale bar 1 um). The peptides were self-assembled on the
imprint mold resulting in a dense network of peptide nanofibers, and then applied to the
plasmonic substrate. Several nanofibers are observed to extend into the gap between two regions
can be observed in the images.
Spatial Distribution of SERS blink events during spot illumination on the SOM
Figure S9. Enhancement uniformity within a diffraction limited focal spot. The laser is
focused to a diffraction limited spot and blinking events are recorded using a monochrome
camera. (a) Frames are processed to extract the peak positions, showing the degree of uniformity
in the spatial distribution of spot positions. Illumination region is shown with red dotted lines.
Several spike like features extending away from the center of illumination spots are attributed to
short term vibrations of the microscope objective in the x-y plane causing a `light-painting` effect
in the measurement. An alternative unlikely explanation is the presence of valley-like hot-spots
that extend linearly over a few hundred nanometers. (b) Intensity versus spatial location of
blinking events is shown.
E- Light induced damage during confocal and wide-field imaging of biological
samples using SERS
Figure S9: a) Confocal Raman image of a peptide network, exhibits apparent fiber diameter of 300 nm as
shown in cross-section profile shown in (b).
Figure S10: (a) The Raman spectra of peptide network exhibits large number of spectral features which
are partially preserved in SERS. (b) At low excitation powers, peptide nanofiber network assembled on
the SERS substrate features Raman spectra with similar bands to conventional Raman spectra. However,
at high powers large and broad spectral features arise around 1300-1500 nm, typically associated with the
formation of carbon clusters. At low powers, SERS spectra are repeatable, although different from
conventional Raman spectra. Amide VI (630-750 cm-1), Amide V (700-750 cm-1), Amide III (1230-1300
cm-1), Amide II (~1550 cm-1) and Amide I (1600-1700 cm-1) bands associated with peptide backbone
structure and side chain composition can be identified in the SERS spectra. Amide I (1600-1700 cm-1)
and Amide III (1230-1300 cm-1) bands were also seen in Raman spectra. However, peak positions and
intensities of the Raman bands can differ significantly.
Figure S11: (a) Bright-field image of Cardiomyocytes on glass, before confocal Raman imaging. (b)
Bright-field image of Cardiomyocytes on glass, before confocal Raman imaging using 10 mW excitation
power. Imaged region shows sample damage due to intense laser light. (c) Raman map collected during
confocal imaging (integrated intensity between 500-3500 cm-1 (scale bar 20 um). (d) Only a broad
autofluorescence and broad double peaks around 1500 cm-1 can be observed in the spectra. The doublepeak is associated with carbon clusters formed due to light induced damage. No sharp Raman bands can
be observed due to strong auto-fluorescence and relative weakness of the Raman signal.
Figure S12. (a) Time dependent SERS spectra recorded on the SOM substrate treated with 1 µM
Methylene Blue. (b) Decay of the 1616 cm-1 peak as a function of time, for several excitation powers,
shows that laser induced molecular breakdown takes place at a rate dependent on excitation power
density. Inset shows Raman spectra at the beginning (i) and end (ii) of acquisition shows arising broad
peaks around 1350 - 1600 cm-1, typically associated with amorphous carbon nano-clusters.
Figure S13: Bright field optical micrograph of an algae membrane (a) before and (b) after widefield SERS imaging. Decrease in the contrast is attributed to evaporation of the membrane due to
prolonged laser excitation (300 sec duration, 40 kW/cm2 peak intensity at 532 nm, scale bars 3 µm). (c)
Representative SERS image from the video sequence which displays rapid and high density blinking spots
(Supplementary Video V6). (d). Confocal Raman map collected on the membrane exhibited carotenoid
peaks at 1,008, 1,160 and 1,515 cm-1 before wide field imaging. (e) Confocal Raman spectra collected
after widefield imaging show carbonization of the sample (evidenced by disappearance of well-defined
peaks and emergence of a broad double peak around 1300-1600 cm-1).
F- Preservation of Raman Bands During Blinking at low excitation power
Figure S14. (a) Schematic description of the measurement setup is shown. A beam splitter is used to
simultaneously capture the video image, while a fiber optic cable (200 µm diameter) is used to collect
Raman spectra from the central spot. (b) Superimposed integrated intensity (solid) from the camera and
spectrometer (dashed) shows reliability of measurement. Blinking events appear as spikes in the intensity.
(c) Time derivative between consecutive spectra during the start of a blinking event confirms that the
camera indeed registers the Raman signal. (d) Location of the blinking event can be seen in the time
derivative of consecutive video frames. (e) Time derivative between consecutive spectra at the end of a
blinking event confirms preservation of Raman bands during the blink. (f) Location of the blinking event
can also be seen in the time derivative of consecutive video frames at the end of blinking. 100 msec
integration time and 500 µW excitation power, slightly defocused to a 0.7 µm diameter spot was used.
G- Confocal Raman image of collapsed cardiomyocyte with an Ag overlayer
Figure S15: (a) In the presence of an Ag overlayer, confocal Raman mapping with 100 µW excitation
power can be performed on a collapsed cardiomyocyte, showing distinct regions with distinct spectral
features. At such low powers, SERS allows observation of Raman bands without inducing damage to the
sample. (b) Various regions exhibit distinct enough spectral features, so that a composite color image can
be formed using different band intensities. (c) Averaged spectrum over the whole imaging area shows
presence of various Raman bands. (d) Raman spectrum collected at location (1) in (b) exhibits distinct
bands. (e) Raman spectrum collected at location (3) in (b) exhibits broad autofluorescence due to
thickness of material concentrated towards the cell centrosome. (f) Raman spectrum collected at location
(2), on fibrillar structures in (b), exhibits distinct bands that slightly differ from that shown in (d).
