Lab 4: Molecular Weight by Freezing Point Depression
advertisement
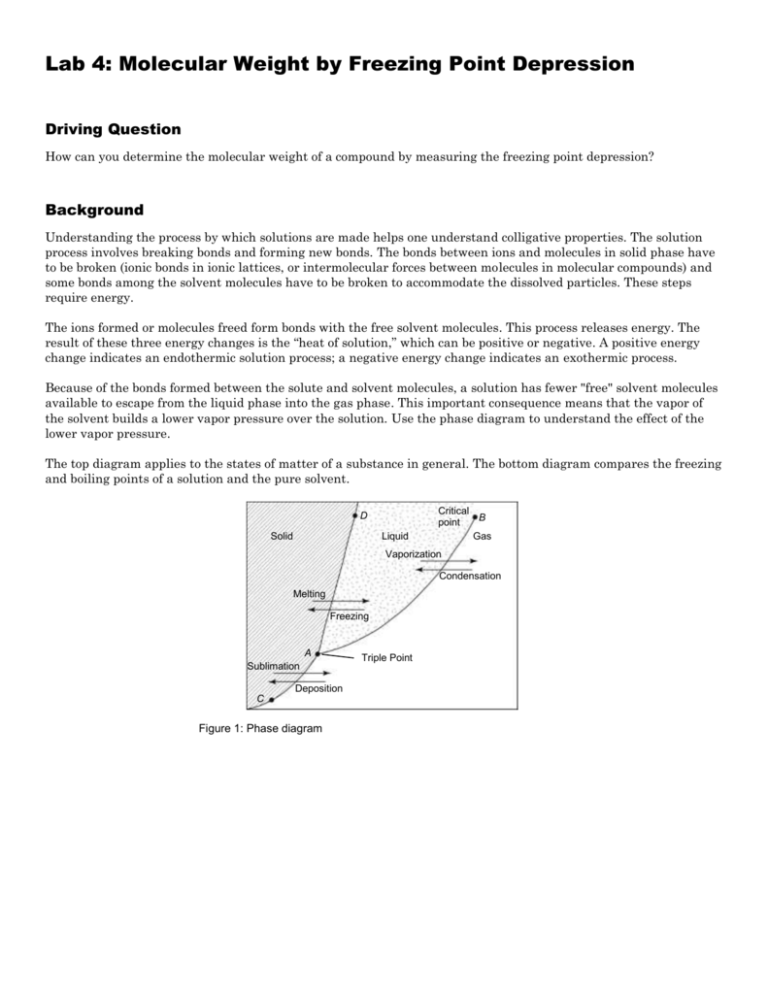
Lab 4: Molecular Weight by Freezing Point Depression Driving Question How can you determine the molecular weight of a compound by measuring the freezing point depression? Background Understanding the process by which solutions are made helps one understand colligative properties. The solution process involves breaking bonds and forming new bonds. The bonds between ions and molecules in solid phase have to be broken (ionic bonds in ionic lattices, or intermolecular forces between molecules in molecular compounds) and some bonds among the solvent molecules have to be broken to accommodate the dissolved particles. These steps require energy. The ions formed or molecules freed form bonds with the free solvent molecules. This process releases energy. The result of these three energy changes is the “heat of solution,” which can be positive or negative. A positive energy change indicates an endothermic solution process; a negative energy change indicates an exothermic process. Because of the bonds formed between the solute and solvent molecules, a solution has fewer "free" solvent molecules available to escape from the liquid phase into the gas phase. This important consequence means that the vapor of the solvent builds a lower vapor pressure over the solution. Use the phase diagram to understand the effect of the lower vapor pressure. The top diagram applies to the states of matter of a substance in general. The bottom diagram compares the freezing and boiling points of a solution and the pure solvent. D Solid Liquid Critical B point Gas Vaporization Condensation Melting Freezing A Sublimation Deposition C Figure 1: Phase diagram Triple Point 1 atm Solid Liquid Gas Pressure Pure liquid solvent Triple point of solvent Solution Pure solid solvent Triple point of solution Freezing point of solution Boiling point of solvent Freezing point of solvent Boiling point of solution } } ΔTf ΔTb Temperature Figure 2: Phase diagram comparing a solution to the pure solvent The phase diagram shows how the vapor pressure over a solution is lower at any given temperature compared with the solvent. Because of the lower vapor pressure over solutions, the vapor pressure reaches the atmospheric pressure at a higher temperature than the boiling point and at a lower temperature than the freezing point of the pure solvent. Compared with pure solvent, the freezing point of solutions is lower and the boiling point of solutions is higher. Note that the standard freezing point phase transition occurs at atmospheric pressure and the standard boiling point phase transition occurs at atmospheric pressure. The respective temperature changes are referred to as the freezing point depression (ΔTf) and boiling point elevation (ΔTb). Another concept to understand is the effects of heat on substances. This can be observed on the heating curve below. F Vapor E D Liquid and vapor (vaporization) Liquid B A C Solid and liquid (melting) Solid Figure 3: Heating curve The temperature of solid (AB), liquid (CD), and gas (EF) phases increases as heat is absorbed. However, at the freezing point and boiling point the temperature remains constant while the heat of fusion (BC) and heat of vaporization (DE) are absorbed. In this activity students will perform the process in the reverse direction: instead of heating, they will cool a liquid solvent and solution until it freezes. Materials and Equipment For each student or group: Data collection system Hotplate Stainless steel temperature sensor Stirring bar Erlenmeyer flask, 250-mL Clamp (2), utility Beaker, 400-mL Lauric acid, CH3(CH2)10COOH, 8 g Test tube, 20-mL Unknown solute, 0.5 g Copper wire coil Water, 300 mL Ring stand Safety Add these important safety precautions to your normal laboratory procedures: Handle the hot water bath carefully while mounting and removing the test tube. Upon completion, wash all equipment properly with the assigned solvent for cleaning. Procedure After you complete a step (or answer a question), place a check mark in the box () next to that step. Note: When you see the symbol "�" with a superscripted number following a step, refer to the numbered Tech Tips listed in the Tech Tips appendix that corresponds to your PASCO data collection system. There you will find detailed technical instructions for performing that step. Your teacher will provide you with a copy of the instructions for these operations. Set Up 1. Start a new experiment on the data collection system �(1.2) 2. Connect the stainless steel temperature sensor to the data collection system. 3. Display data on the graph to show Temperature versus Time. 4. Measure about 8 g of lauric acid and record the mass of this 0.01 g in Table 1. �(2.1) �(7.1.1) solvent to the nearest 5. Place a 400-mL beaker 3/4 full of water on a hotplate. 6. Place a stirring bar into the beaker. 7. Use a clamp to connect the test tube to the ring stand so it water as far as possible. If necessary, add more water to is immersed in the the beaker. 8. The copper wire coil will wrap around the stainless steel clamp it to the ring stand and insert it into the test tube as sensor. You will shown in the illustration AFTER you melt the solvent Collect Data 9. Carefully transfer the solvent into the test tube. Important: Make sure there is no loss of the sample when doing a transfer. 10. Turn on the hotplate and the stirring bar. 11. When the crystals melt, place the stainless steel sensor with the copper coil wrapped around it into the melted crystals. Note: Observe the white deposit on the surface of the sensor. 12. What is the white deposit and why does it appear on the sensor? 13. Once the test tube is clear (the crystals are melted), from the water bath, with the sensor and coil still in it, empty Erlenmeyer flask. remove the test tube and clamp it in the Important: Do not stop stirring while collecting data. Even a few can affect your graph. seconds without stirring 14. Start data recording �(6.2) and start stirring the contents of moving the copper coil up and down. the test tube by 15. Adjust the scale of the graph. �(7.1.2) 16. Once the contents of the test tube are completely solidified, stop data recording. �(6.2) 17. Mount the test tube into the water bath again and allow test tube to melt. the contents of the 18. Measure about 0.5 g of the unknown sample to the nearest 0.01 g and record the mass in Table 1. 19. Carefully transfer the solute into the test tube. Important: Make sure there is no loss of the sample when making the transfer. 20. What happens if you lose some of the sample during the transfer? 21. Once the test tube is clear (the crystals are melted), remove the test tube from the water bath, with the sensor and coil still in it, and clamp it in the empty Erlenmeyer flask. Important: Do not stop stirring while collecting data. Even a few seconds without stirring can affect your graph. 22. Start the data recording �(6.2) and start stirring the contents of the test tube by moving the copper coil up and down. 23. Once the contents of the test tube are completely solidified, stop data recording. �(6.2) 24. Display both data runs in the graph. �(7.1.3) 25. From the curves, locate the freezing points of the pure solvent and the solution. Record these in Table 1. 26. Print the graph. �(11.2) 27. Melt the contents of the test tube again and dispose of the chemicals into the designated waste container. 28. Save your experiment �(11.1) and clean up according to your teacher's instructions. Data Analysis Table 1: Freezing point depression measurements and calculations Parameter Mass of the lauric acid (g) Mass of the unknown sample # ______ (g) Freezing point of lauric acid (°C ) Freezing point of lauric acid mixed with the unknown solute (°C) Change in freezing point (°C) Molar mass (experimental) of unknown solute (g/mol) Molality of the solution (mol/kg) Moles of the unknown sample #_______(mol) Possible solute Molar mass (from Table 2) of possible solute (g/mol) Percentage of error (%) 1. Calculate the formula weight of the solute. Value Note: Kf for lauric acid is 3.90 K kg mol–1. 2. Calculate the number of moles of the solute used, based on the calculated formula weight and determine the molality of the solution. 3. Based on the formula weights of the compounds in Table 2, what solute have you been using? Record it and its formula weight in Table 1. Table 2: Formula weights of different compounds Name Formula Formula weight (g/mol) Salicylic acid 138.1 Benzoic acid 4. Determine the percent error between the experimental molar mass and the molar mass from Table 2. 5. What are the sources of error?( explain how each error would affect the results as it did) 122.4 Acetylsalicylic acid (aspirin) Acetyl phenol 180.2 6. Sketch or paste the graph with the cooling curves as shown in the example below. Label the curve corresponding to the solvent and the curve corresponding to the solution. 136.1 POST LAB Questions 1. Why is lauric acid the solvent in this experiment, even though lauric acid is solid at room temperature and solvents are usually liquids at room temperature? 2. How would the error show itself if the test tube was dirty? 3. Suppose you collected data for an additional cooling curve, adding additional unknown sample to the solution; sketch a graph with the three cooling curves and label each curve. 4. Why would you collect data for an additional cooling curve with additional unknown sample? B. Assuming the same mass of unknown A and B (ms) and the same mass of solvent (msolvent) are used, a greater freezing point depression with A would mean that A has a greater formula weight than B. C. Assuming the same mass of unknown A and B (ms) and the same mass of solvent (msolvent) are used, a greater freezing point depression with A would mean that B has a smaller formula weight than A. D. Not enough information Pre-Lab Activity Setting the stage for the activity As a solute is added to a solvent, the freezing point of the resulting solution is lowered. The freezing point depression of the solution is dependent on two things: the solvent and the amount of solute added. However, it does not depend on the nature of the solute. The following equation describes this relationship: ΔTf K f m Where ΔTf = the freezing point depression (K) Kf = the freezing point depression constant for a particular solvent (K kg mol–1) m = the molality of the solution (mol/kg) Stated another way: Where ΔTf K f ns msolvent ns = number of moles of solute (mol) msolvent = mass of solvent (kg) Moles of solute can be determined from the following equation: ns Where ms FWs ms = mass of solute (g) FWs = formula weight of solute (g/mol) Replacing ns with this expression yields ms FWs ms ΔTf K f Kf msolvent msolvent FWs Rearranging, the molecular weight of the solute is FWs K f ms ΔTf msolvent In this experiment, you will measure the freezing point of a pure solvent, lauric acid (dodecanoic acid). You will measure the freezing point of a mixture of lauric acid and an unknown solute. From the freezing point change, the formula weight of the solute can be calculated. To obtain the cooling curve, the melted solvent or the melted solution must be cooled very slowly. During this time, the temperature of the system is monitored and the contents of the test tube are continuously mixed. Example calculation to try In an experiment, the formula weight of an unknown organic substance is determined. First, the freezing point is determined for 8.50 g (0.00850 kg) of solvent placed in a test tube. Then the contents of the test tube are melted and 0.9407 g of the unknown substance is dissolved in the liquid. As the graph shows, the freezing point of the solution is also measured. Kf for the solvent is 3.90 K kg mol–1. The freezing point of the pure solvent is 43.8 °C. The freezing point of the solution is 41.2 °C. Therefore the freezing point depression is 2.60 °C, or 2.60 K. Substituting these values into the relevant equation to find the formula weight: 0.9407g K kg g FWs 3.90 166 mol 2.60 K 0.00850 kg mol 1. Why is the vapor pressure lower over solutions than over the pure solvent? 2. How does a lower vapor pressure result in standard boiling point elevation? from the liquid phase and ending with the solid phase. Label the axes, the points where freezing starts , freezing ends, and label the freezing point. 4. Why does the temperature remain constant at the freezing point? 5. Using the fact that the temperature remains constant at the freezing point for a an interval of time, how would you measure the freezing point change of a solution relative to the freezing point of a pure solvent?
