SamplingIntro
advertisement
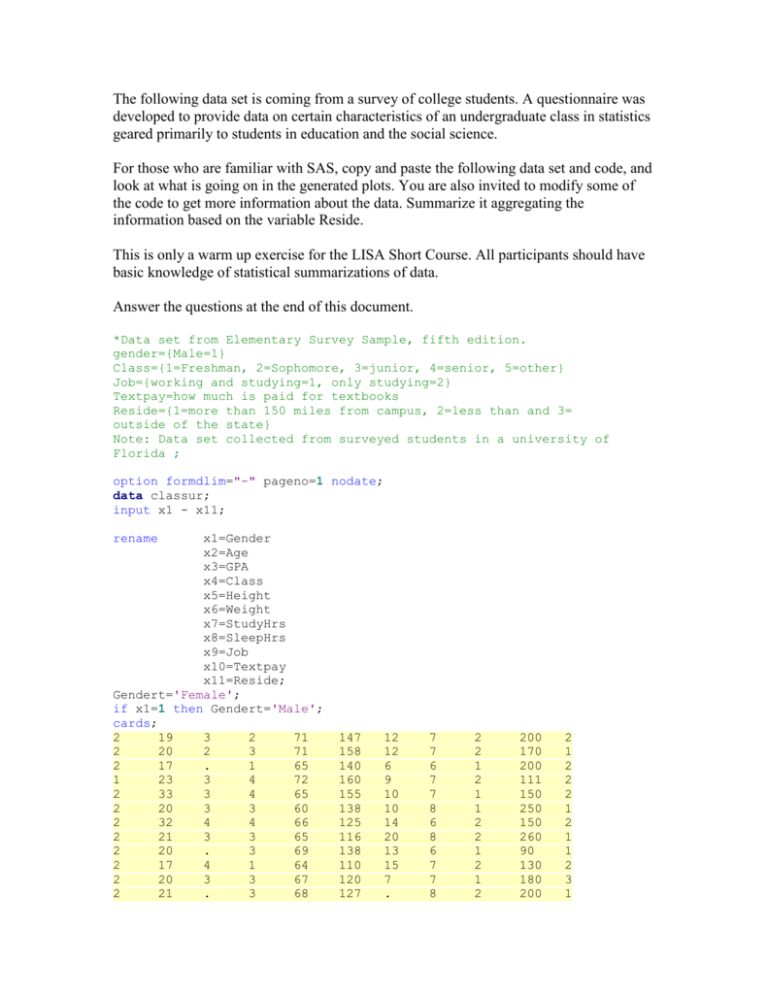
The following data set is coming from a survey of college students. A questionnaire was
developed to provide data on certain characteristics of an undergraduate class in statistics
geared primarily to students in education and the social science.
For those who are familiar with SAS, copy and paste the following data set and code, and
look at what is going on in the generated plots. You are also invited to modify some of
the code to get more information about the data. Summarize it aggregating the
information based on the variable Reside.
This is only a warm up exercise for the LISA Short Course. All participants should have
basic knowledge of statistical summarizations of data.
Answer the questions at the end of this document.
*Data set from Elementary Survey Sample, fifth edition.
gender={Male=1}
Class={1=Freshman, 2=Sophomore, 3=junior, 4=senior, 5=other}
Job={working and studying=1, only studying=2}
Textpay=how much is paid for textbooks
Reside={1=more than 150 miles from campus, 2=less than and 3=
outside of the state}
Note: Data set collected from surveyed students in a university of
Florida ;
option formdlim="-" pageno=1 nodate;
data classur;
input x1 - x11;
rename
x1=Gender
x2=Age
x3=GPA
x4=Class
x5=Height
x6=Weight
x7=StudyHrs
x8=SleepHrs
x9=Job
x10=Textpay
x11=Reside;
Gendert='Female';
if x1=1 then Gendert='Male';
cards;
2
19
3
2
71
2
20
2
3
71
2
17
.
1
65
1
23
3
4
72
2
33
3
4
65
2
20
3
3
60
2
32
4
4
66
2
21
3
3
65
2
20
.
3
69
2
17
4
1
64
2
20
3
3
67
2
21
.
3
68
147
158
140
160
155
138
125
116
138
110
120
127
12
12
6
9
10
10
14
20
13
15
7
.
7
7
6
7
7
8
6
8
6
7
7
8
2
2
1
2
1
1
2
2
1
2
1
2
200
170
200
111
150
250
150
260
90
130
180
200
2
1
2
2
2
1
2
1
1
2
3
1
2
19
.
2
61
2
21
3
3
64
2
20
3
3
62
1
25
3
4
66
1
26
3
4
70
1
20
3
2
70
2
17
.
1
64
1
19
3
3
71
2
18
3
2
64
2
42
4
4
63
1
22
3
4
67
2
21
3
4
67
2
18
.
1
67
2
20
3
3
66
2
20
3
3
66
1
19
3
3
73
1
20
3
3
71
2
20
3
3
63
1
20
3
3
67
2
22
3
4
62
2
18
.
1
67
2
18
.
1
.
1
21
3
4
68
2
20
3
3
65
1
22
3
4
76
2
21
3
3
65
2
20
3
3
61
1
20
3
3
75
1
22
4
5
65
1
34
4
5
73
1
20
3
2
71
1
18
3
3
67
2
20
3
3
.
2
23
3
4
64
1
22
3
4
75
2
19
3
3
61
1
21
3
2
71
1
19
3
3
68
1
19
3
2
67
2
20
2
3
63
2
17
.
1
68
1
21
3
4
74
2
20
3
3
68
1
21
3
4
69
1
18
3
1
58
;
proc sgplot data=classur;
title 'Histogram of AGE';
histogram age;
density age/type=kernel;
proc sgplot;
title 'Histogram of Height';
histogram height;
density height/type=kernel;
proc sgplot;
title 'Histogram of Weight';
115
133
105
160
160
178
.
170
106
140
147
135
130
150
118
167
175
123
147
.
.
108
145
118
220
112
105
160
140
175
175
153
.
128
225
110
183
130
156
128
175
240
122
195
155
11
7
12
40
8
7
9
10
13
10
30
14
10
14
14
10
5
7
10
7
15
12
26
25
16
14
10
9
10
30
7
15
14
5
6
5
5
3
15
35
13
18
13
10
16
7
8
6
6
6
7
6
8
6
7
6
7
8
6
8
7
8
6
5
8
7
5
7
6
5
7
8
9
9
7
8
9
4
6
7
7
5
9
7
5
6
6
6
7
6
1
1
1
1
2
1
2
1
2
1
2
2
2
2
2
1
2
1
1
2
2
2
2
2
1
1
2
1
1
1
2
2
2
1
2
2
1
1
2
2
2
1
1
2
1
51
100
200
90
245
200
220
200
200
150
320
200
145
.
216
200
150
185
220
120
198
160
400
150
250
210
175
200
240
120
200
90
260
49
95
300
225
200
180
250
280
240
250
230
200
1
2
1
2
3
3
1
2
2
2
1
1
1
1
1
2
2
1
1
1
3
2
2
2
1
1
1
2
1
2
1
2
2
2
2
3
1
3
2
1
1
1
2
2
2
histogram weight;
density weight/type=kernel;
run;
proc sgplot data=classur;
title 'Histogram of Hours of Study';
histogram studyhrs;
density studyhrs /type=kernel;
proc sgplot data=classur;
title 'Box plot for Weight by gender';
hbox weight /category=gendert;
proc sgplot data=classur;
title 'Box plot for Heigth by gender';
hbox height /category=gendert;
proc sgplot data=classur;
title 'Box plot for Sleeping hours by gender';
hbox sleephrs /category=gendert;
proc sgplot data=classur;
title 'Box plot for Dollar Amount paid for Textbook by gender';
hbox textpay /category=gendert;
proc sgplot data=classur;
title 'Box plot for Hours of study by gender';
hbox studyhrs /category=gendert;
proc sgplot data=classur;
title 'Box plot for Hours of study by job';
hbox studyhrs /category=job;
proc sgplot data=classur;
title'scatter plot for Weight and Height';
scatter y=height x=weight;
ellipse y=height x=weight;
run;
quit;
For those that do not want to do anything with SAS, just look at the following plots.
Think about them and try to draw your own conclusions about the relationships between
the variables, taking advantage of all the tools you have from any statistics classes you
have taken.
Questions:
What can you say about Age, Height, and Weight, based on the shown plots above?
Who are taller?
Who are heavier?
What is the scatter plot of Weight versus Height telling you?
Who pays more money for textbooks, guys or gals?
Who spend more time sleeping?
Do you think that having a job affects the studying time and the sleeping time?
All those questions should be carefully answered. Thinking about them would help you in
figuring out how to extract useful information from a data set. With the survey data, this
sort of analysis should be done in the first place.
