SAS Chapter 8 - University of South Carolina
advertisement
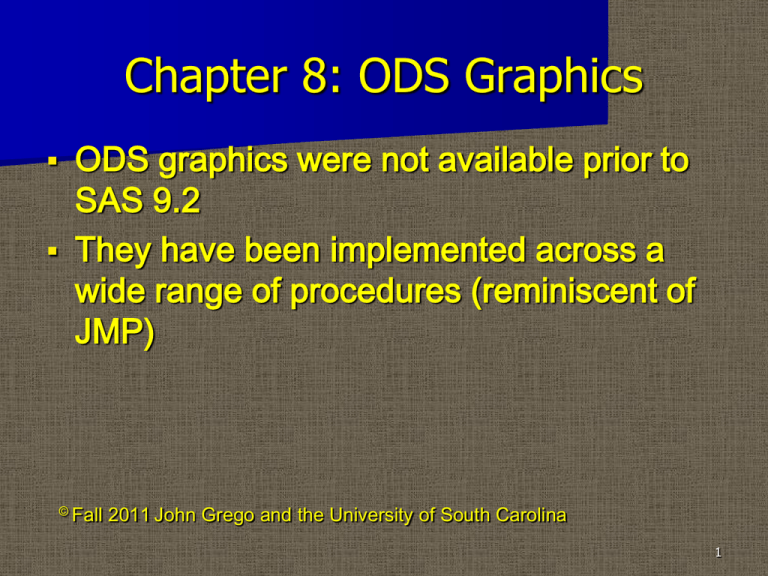
Chapter 8: ODS Graphics ODS graphics were not available prior to SAS 9.2 They have been implemented across a wide range of procedures (reminiscent of JMP) © Fall 2011 John Grego and the University of South Carolina 1 Chapter 8: ODS Graphics Graphs can be routed to different devices (default is LISTING) For default output, graphs are available in the Results window as separate objects The default graph type is .png; it can be modified to .jpg, etc Some style choices are readily edited © Fall 2011 John Grego and the University of South Carolina 2 PROC SGPLOT Omnibus procedure to create ODS graphics We will review − Bar charts − Histograms and box plots − Scatterplots − Time series plots − Fitted curves 3 PROC SGPLOT-Bar Charts Creates vertical or horizontal bar charts Groups can be added Bars can actually be summary statistics for continuous variables PROC SGPLOT; VBAR varname/ GROUP=catname; VBAR varname/ RESPONSE=varname STAT=stattype; LABEL varname=‘varlabel; 4 PROC SGPLOT-Histograms SCALE subcommand graphs percents, counts, or proportions on the vertical axis DENSITY overlays a normal curve (default) or kernel density estimate PROC SGPLOT; HISTOGRAM varname; DENSITY varname; DENSITY varname/TYPE=kernel ; 5 PROC SGPLOT-Boxplots VBOX specifies graphing variables CATEGORY generates side-by-side plots PROC SGPLOT; VBOX varname/ CATEGORY=catvarname; 6 PROC SGPLOT-Scatter Plots Alternative to PROC GPLOT Multiple SCATTER statements produce overlaid plots LABEL improves the legend for overlaid plots GROUP creates different plotting symbols PROC SGPLOT; SCATTER X=hname Y=vname; GROUP=groupname; XAXIS LABEL=‘xlabel’ VALUES=(low TO high BY increment); 7 PROC SGPLOT-Time Series Plots Data points are connected by lines by default The horizontal axis will be time, date, etc LABEL command for dates follows naming conventions we have seen before PROC SGPLOT; SERIES X=timeindex Y=vname; GROUP=groupname; XAXIS LABEL=‘xlabel’ VALUES=(‘ddmmmyy’d TO ‘ddmmmyy’d BY increment); 8 PROC SGPLOT-Fitted Curves A scatterplot is automatically generated for REG, LOESS, or PBSPLINE CLM adds confidence bounds NOMARKER suppresses the oft-redundnat printing of the scatter plot PROC SGPLOT; REG X=hname Y=vname; LOESS X=hname Y=vname; PBSPLINE X=hname Y=vname; 9 PROC SGPANEL Panel graphs are an increasingly preferred alternative to traditional methods for multi-graph displays. PROC SGPANEL ; PANELBY variablelist; SCATTER X=hname Y=vname; SERIES X=index Y=vname; Etc. 10
