Study Island
Copyright © 2015 Edmentum - All rights reserved.
Generation Date: 02/22/2015
Generated By: Robert Dilliplane
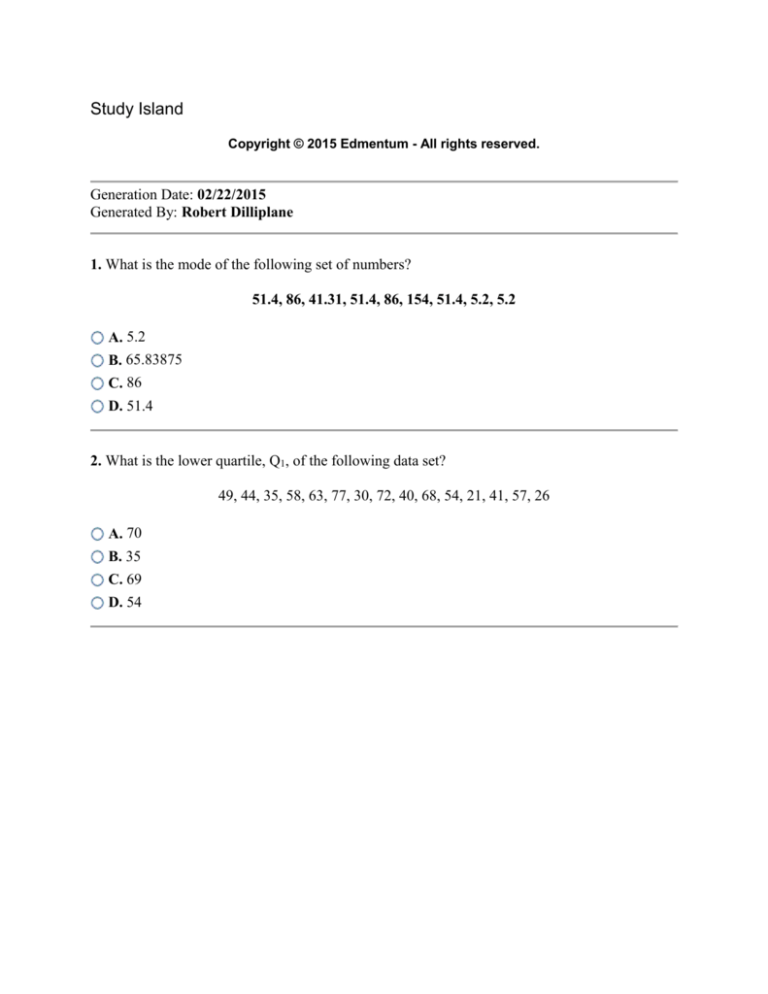
1. What is the mode of the following set of numbers?
51.4, 86, 41.31, 51.4, 86, 154, 51.4, 5.2, 5.2
A. 5.2
B. 65.83875
C. 86
D. 51.4
2. What is the lower quartile, Q1, of the following data set?
49, 44, 35, 58, 63, 77, 30, 72, 40, 68, 54, 21, 41, 57, 26
A. 70
B. 35
C. 69
D. 54
3. Angela recorded the ages of the people in sales and the people in accounting at her company
below.
Sales: 28, 27, 25, 32, 36, 33, 30
Accounting: 34, 37, 35, 32, 38, 42, 40
How does the interquartile range of the ages of the people in sales compare to the interquartile
range of the ages of the people in accounting?
The interquartile range for sales is 6 years less than the interquartile range for accounting.
A.
B.
The interquartile ranges for sales and accounting are both 6 years.
The interquartile range for sales is 7 years greater than the interquartile range for
C. accounting.
D.
The interquartile ranges for sales and accounting are both 7 years.
4. Every year the county fair holds a grape-eating contest. The numbers of grapes eaten by
thirteen contestants in 30 seconds are listed below.
70, 62, 84, 90, 86, 75, 77, 78, 63, 56, 65, 70, 84
What is the interquartile range of the set of data?
A. 19
B. 21
C. 34
D. 20
5. What is the mean of the following set of numbers?
30.78, 18, 3.02, 20
A. 16.98
B. 8.975
C. 17.95
D. 3.02
6. Mike, Shannon, Layla, and Rachel each recorded the grades they received on five tests in their
math class in the table below.
Student
Test Scores
Test 1 Test 2 Test 3 Test 4 Test 5
Mike
78
68
65
88
70
Shannon
97
85
84
89
93
Layla
74
80
79
72
73
98
Rachel
What is the range of Layla's scores?
A. 9
76
71
77
81
B. 13
C. 6
D. 8
7. What is the range of the following set of numbers?
33.47, 31.57, 40.67, 41.67, 38.57, 32.57, 30.47, 38.67, 29.47
A. 12.2
B. 35.24
C. 9.2
D. 41.67
8. What is the interquartile range of the following data set?
408, 473, 493, 526, 508, 429, 453
A. 79
B. 100
C. 118
D. 473
9. A company conducted a survey of 5,832 people to find out the fastest speed they have driven
in certain cities. Based on the table below, what is the difference between sample's interquartile
range and the population's interquartile range?
Minimum 1st Quartile 2nd Quartile 3rd Quartile Maximum
Name
Macon
66
82
93
101
111
Augusta
66
76
98
105
113
Decatur
72
78
86
97
105
Jefferson
72
85
89
105
117
Population
64
74
97
104
125
A. There is a difference of 5.25.
B. There is a difference of 11.25.
C. There is a difference of 12.6.
D. There is a difference of 8.25.
10. What is the upper quartile, Q3, of the following data set?
51, 46, 38, 62, 64, 71, 37, 70, 40, 65, 56, 31, 42, 60, 32
A. 64
B. 56
C. 62
D. 71
11. What is the median of the following set of numbers?
111, 180, 194, 123, 227, 146, 167, 145, 210, 214
A. 173.5
B. 180
C. 116
D. 170
12. What is the median of the following set of numbers?
41.7 , 38 , 43.7 , 40 , 38 , 38.3 , 36.3 , 44.7 , 42
A. 43.7
B. 40
C. 38.3
D. 36.3
Answers
1. D
2. B
3. B
4. D
5. C
6. D
7. A
8. A
9. D
10. A
11. A
12. B
Explanations
1. The mode is the number that appears most often in a set of numbers. In this set, 51.4 appears
most often.
The mode of this set of numbers is 51.4.
2. First find the median by putting the numbers in order.
21, 26, 30, 35, 40, 41, 44, 49, 54, 57, 58, 63, 68, 72, 77
The median of the entire set is 49.
Now, to find the lower quartile, Q1, locate the median of the set of numbers less than 49.
21, 26, 30, 35, 40, 41, 44
Thus, the lower quartile of the data is 35.
3. First, list the ages in order.
Sales: 25, 27, 28, 30, 32, 33, 36
Accounting: 32, 34, 35, 37, 38, 40, 42
Next, find the median of each set of ages. This will be the fourth value in both data sets.
Sales: 25, 27, 28, 30, 32, 33, 36
Accounting: 32, 34, 35, 37, 38, 40, 42
The lower and upper quartiles of the data are the medians of the values below and above the
median, respectively. These will be the second and sixth values in each data set.
Sales: 25, 27, 28, 30, 32, 33, 36
Accounting: 32, 34, 35, 37, 38, 40, 42
Subtract the lower quartile from the upper quartile to find the interquartile range.
Sales: 33 - 27 = 6
Accounting: 40 - 34 = 6
Therefore, the interquartile ranges for sales and accounting are both 6 years.
4. First put the numbers in order:
56, 62, 63, 65, 70, 70, 75, 77, 78, 84, 84, 86, 90
The median (Q2) of the whole set is 75. Then find the median of all numbers greater than 75.
77, 78, 84, 84, 86, 90
Since there are two median numbers and they are both the same, 84 is the upper quartile (Q3).
Next, find the median of all numbers less than 75.
56, 62, 63, 65, 70, 70
Since there are two median number, find the mean of the two values to find the median value of
the lower quartile.
(63 + 65) ÷ 2 = 64
So, 64 is the lower quartile (Q1).
To find the interquartile range, subtract the lower quartile from the upper quartile.
(Q3) - (Q1) = 84 - 64 = 20
The interquartile range is 20.
5. To find the mean, add the numbers together and divide by 4.
The mean of this set of numbers is 17.95.
6. The range of a sample is the difference between the largest and smallest value in the sample.
In this case, the sample is Layla's test scores.
Subtract Layla's lowest test score, 72, from her highest test score, 80.
80 - 72 = 8
7. The range is the difference between the smallest number and largest number in a set of
numbers. To find the range, subtract the smallest number (29.47) from the largest number
(41.67).
41.67 - 29.47 = 12.2
The range of this set of numbers is 12.2.
8. First put the numbers in order:
408, 429, 453, 473, 493, 508, 526
The median (Q2) of the whole set is 473. Then find the median of all numbers greater than 473.
493, 508, 526
So, 508 is the upper quartile (Q3).
Next, find the median of all numbers less than 473.
408, 429, 453
So, 429 is the lower quartile (Q1).
To find the interquartile range, subtract the lower quartile from the upper quartile.
(Q3) - (Q1) = 508 - 429 = 79
Therefore, the interquartile range is 79.
9. Find the average interquartile range for the sample and compare it to the Population.
Macon has an interquartile range of 19.
Augusta has an interquartile range of 29.
Decatur has an interquartile range of 19.
Jefferson has an interquartile range of 20.
The mean of the sample is 21.75.
Population's interquartile range is 30
There is a difference of 8.25.
10. First find the median by putting the numbers in order.
31, 32, 37, 38, 40, 42, 46, 51, 56, 60, 62, 64, 65, 70, 71
The median of the entire set is 51.
Then, for the upper quartile, find the median of all numbers greater than 51.
56, 60, 62, 64, 65, 70, 71
Thus, the upper quartile of the data set is 64.
11. To find the median, first order the numbers from smallest to largest, then select the middle
number(s).
111, 123, 145, 146, 167, 180, 194, 210, 214, 227
In this case, there are two middle numbers, since the set contains an even number of entries. So,
in order to determine the median, calculate the average of the two middle numbers.
Therefore, the median of this set of numbers is 173.5.
12. Put the numbers in order from smallest (36.3) to largest (44.7).
36.3 , 38 , 38 , 38.3 , 40 , 41.7 , 42 , 43.7 , 44.7
The number in the middle is 40.
Therefore, the median of this set of numbers is 40.


