Full Article
advertisement
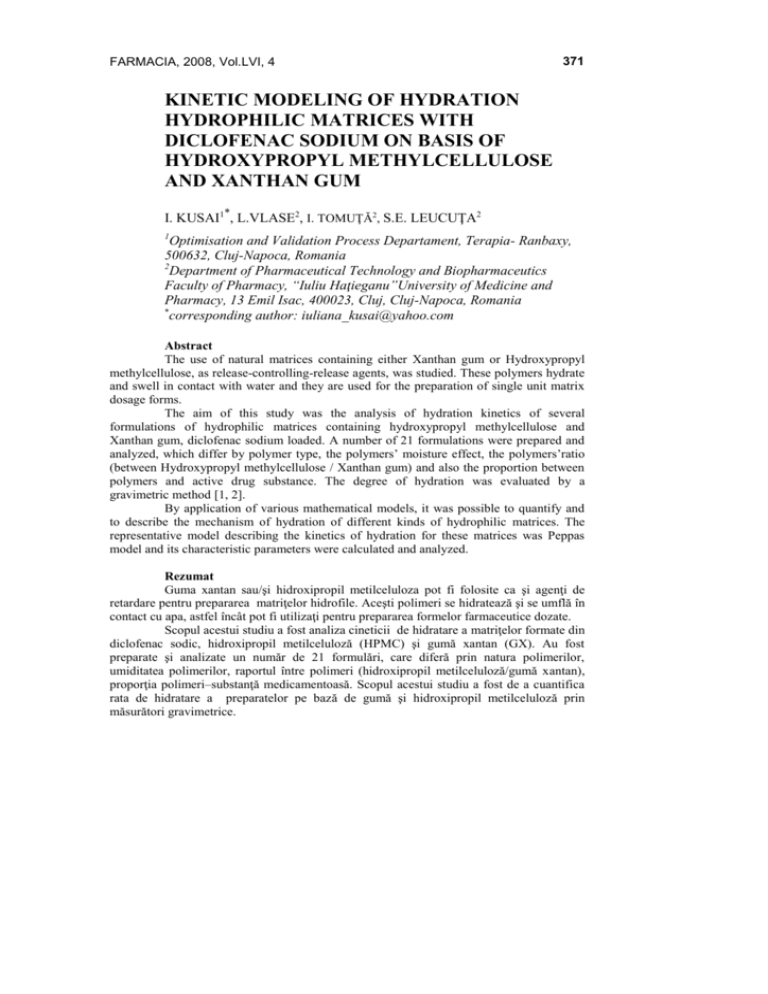
FARMACIA, 2008, Vol.LVI, 4 371 KINETIC MODELING OF HYDRATION HYDROPHILIC MATRICES WITH DICLOFENAC SODIUM ON BASIS OF HYDROXYPROPYL METHYLCELLULOSE AND XANTHAN GUM I. KUSAI1*, L.VLASE2, I. TOMUŢĂ2, S.E. LEUCUŢA2 1 Optimisation and Validation Process Departament, Terapia- Ranbaxy, 500632, Cluj-Napoca, Romania 2 Department of Pharmaceutical Technology and Biopharmaceutics Faculty of Pharmacy, “Iuliu Haţieganu”University of Medicine and Pharmacy, 13 Emil Isac, 400023, Cluj, Cluj-Napoca, Romania * corresponding author: iuliana_kusai@yahoo.com Abstract The use of natural matrices containing either Xanthan gum or Hydroxypropyl methylcellulose, as release-controlling-release agents, was studied. These polymers hydrate and swell in contact with water and they are used for the preparation of single unit matrix dosage forms. The aim of this study was the analysis of hydration kinetics of several formulations of hydrophilic matrices containing hydroxypropyl methylcellulose and Xanthan gum, diclofenac sodium loaded. A number of 21 formulations were prepared and analyzed, which differ by polymer type, the polymers’ moisture effect, the polymers’ratio (between Hydroxypropyl methylcellulose / Xanthan gum) and also the proportion between polymers and active drug substance. The degree of hydration was evaluated by a gravimetric method [1, 2]. By application of various mathematical models, it was possible to quantify and to describe the mechanism of hydration of different kinds of hydrophilic matrices. The representative model describing the kinetics of hydration for these matrices was Peppas model and its characteristic parameters were calculated and analyzed. Rezumat Guma xantan sau/şi hidroxipropil metilceluloza pot fi folosite ca şi agenţi de retardare pentru prepararea matriţelor hidrofile. Aceşti polimeri se hidratează şi se umflă în contact cu apa, astfel încât pot fi utilizaţi pentru prepararea formelor farmaceutice dozate. Scopul acestui studiu a fost analiza cineticii de hidratare a matriţelor formate din diclofenac sodic, hidroxipropil metilceluloză (HPMC) şi gumă xantan (GX). Au fost preparate şi analizate un număr de 21 formulări, care diferă prin natura polimerilor, umiditatea polimerilor, raportul între polimeri (hidroxipropil metilceluloză/gumă xantan), proporţia polimeri–substanţă medicamentoasă. Scopul acestui studiu a fost de a cuantifica rata de hidratare a preparatelor pe bază de gumă şi hidroxipropil metilceluloză prin măsurători gravimetrice. 372 FARMACIA, 2008, Vol.LVI, 4 Au fost aplicate diferite modele matematice, făcând posibila cuantificarea şi descrierea mecanismului de hidratare din matriţele de diclofenac sodic. Dintre modelele matematice empirice, cel care a descris cel mai bine cinetica de hidratare a fost modelul Pepas. Pentru acest model au fost calculaţi şi analizaţi parametrii caracteristici. Diclofenac Sodium Xanthan Gum Hydroxypropyl Methylcellulose Matrices Hydration INTRODUCTION It has been shown that drug release from hydrophilic matrices is a complex interaction between swelling, diffusion and erosion [3]. The gradual penetration of water produces swelling and forms a hydrated gel through which the drug has to pass by dissolution and diffusion across the ever-increasing diffusional pathway length. Swelling has been shown to follow square root of time kinetics. However, drugs contained in certain systems are released at rates approaching zero order. It is apparent, therefore, that other mechanisms, in addition to diffusion, must take place at the interface between the gel and the surrounding medium. The polymer chains will gradually disentangle from the interface. This polymer chain relaxation will increase the rate of drug release by decreasing the diffusional path length for the drug. It is important to try to quantify the degree of hydration from matrix surface interfacing with the aqueous dissolution medium. The objective of this study was to determine the degree of hydration by gravimetric method and to characterize the prepared formulations from the point of view of hydration kinetics [1, 4]. MATERIALS AND METHODS Materials Diclofenacum sodium (Terapia S.A. Romania), Hydroxypropyl methylcellulose (HPMC) - Methocel K 4M CR (Colorcon Ltd., UK), Xanthan Gum (Colorcon Ltd., UK), colloidal silicon dioxide - Aerosil (Terapia S.A. Romania), magnesium stearate (Terapia S.A. Romania). Tablets preparation Tablets were directly compressed using rotation tabletting machine (Ronchi EA/8) at a compression force about 12 kN. 373 FARMACIA, 2008, Vol.LVI, 4 Table I The formulations of experimental design No. Exp. Diclofenac sodium (mg) Methocel K4 MCR (mg) Xanthan Gum (mg) Aerosil (mg) Magnesium Stearate (mg) Weight of tablets (mg) N1 N2 N3 N4 N5 N6 N7 N8 N9 N10 N11 N12 N13 N14 N15 N16 N17 N18 N19 N20 N21 100 100 100 100 100 100 100 100 100 100 100 100 100 100 100 100 100 100 100 100 100 166.7 333.3 110.0 56.0 83.4 166.7 83.4 166.7 250.0 83.4 250.0 56.0 125.0 125.0 125.0 250.0 500.0 166.6 - 333.3 166.7 56.0 110.0 166.7 83.4 166.7 83.4 250.0 83.4 250.0 110.0 125.0 125.0 125.0 250.0 500.0 166.7 1.2 1.2 0.5 0.5 0.7 0.7 0.7 0.7 1.2 0.5 1.2 0.5 0.7 0.7 0.7 0.7 0.7 1.2 1.2 0.5 0.5 6.0 6.0 2.7 2.7 3.7 3.7 3.7 3.7 6.0 2.7 6.0 2.7 3.7 3.7 3.7 3.7 3.7 6.0 6.0 2.7 2.7 607.2 607.2 269.2 269.2 354.4 354.4 354.4 354.4 607.2 269.2 607.2 269.2 354.4 354.4 354.4 354.4 354.4 607.2 607.2 269.2 269.2 Hydration test of the tablets The studies were carried out using a Pharma Test PT-DT7 dissolution tester (PharmaTest, Germania), fitted with six rotating baskets. The dissolution medium used was 900 ml of distilled water maintained at 37±0.5°C by the constant temperature water bath. Agitation speed 100±1 rpm was used during the experiment. Each basket was thoroughly cleaned, accurately weighed and weighed again after insertion of a matrix tablet, so that the accurate weight of each tablet could be calculated. The basket and tablets were then rotated in the dissolution medium and at regular time intervals (usually 15, 30, 60, 120, 240, 360 and 480 minutes) the basket was detached, blotted with absorbents tissue to remove any excess medium on the basket surface and accurately weighed on a Sartorius analytical balance. 374 FARMACIA, 2008, Vol.LVI, 4 Selecting the mathematical model of analysis The experimental data were analyzed using four kinetic mechanistic models as it is shown in table II [5, 6]. Table II Hydration kinetic models used for the analysis of diclofenacum sodium tablets Model Kinetic model Parameters Equation M1 Zero order tlag, tced 1 M2 First order tlag, k1 2 M3 Higuchi tlag, k Higuchi 3 M4 Peppas tlag, k Peppas, n 4 where tlag represents the lag time until the start of a kinetic process; tced is the release time for zero order kinetics, k represents the release rate constant of a first order kinetic process, Higuchi or Peppas; the indicatives “1”, “0”, “Higuchi”, “Peppas” associate a parameter with a certain type of kinetics. From usual selection criteria (Akaike, Schwartz criteria, and residual analysis) the Akaike criterion [7] was chosen for distinguishing among competing models. In this criterion a lower value of the indicator means a better fit. The fitting method was realized with the WinNonlin [8] program. On the basis of the Akaike indicator we selected the mathematical model, which describes the release profile for all the analyzed samples with the greatest accuracy. The kinetic models for mechanistic models (1-4) were selected. Equation 1. Zero order model %dissolved=100*t/tced Equation 2. First order model %dissolved=100(1-e-k*t) Equation 3. Higuchi model %dissolved=k*(t)0.5 Equation 4. Peppas model %dissolved=k*(t)n 375 FARMACIA, 2008, Vol.LVI, 4 RESULTS AND DISCUSSION The tablets’ increase in weight at various time intervals is shown in Figure 1. 14.00 N N N N N N N N N N N N N N N N N N N 12.00 10.00 8.00 6.00 4.00 2.00 0.00 0 100 200 300 400 500 600 1 10 11 12 13 2 3 4 5 6 7 8 9 16 17 18 19 20 21 Figure 1 Hydration profiles of the examined formulations Figures 2 and 3 show a relatively nonlinear increase of the degree of hydration in time. For the first order kinetic it is considered that on the last determination a maximum swelling happens and the percentage are 100%. It is recalculated % of the swelling at various time intervals. After individual fitting on with first order kinetics, the experimental data do not fit with the model. 100 Formulation N3 90 80 70 60 50 Observed 40 Predicted 30 20 10 0 0 50 100 150 200 250 300 350 400 450 500 Time Figure 2 First order kinetic fitting of the data for the formulation N3 376 FARMACIA, 2008, Vol.LVI, 4 100 Formulation N8 90 80 70 60 50 Observed 40 Predicted 30 20 10 0 0 50 100 150 200 250 300 350 400 450 500 Time Figure 3 First order kinetic fitting of the data for the formulation N8 There was an increase of relative weight compared to initial weight for fitting data of Peppas and Higuchi kinetics. In the following tables the data which were used in mathematic equation no. 3 and no. 4. are shown. Table III Relative weight at various time intervals No. exp N1 N2 N3 N4 N5 N6 N7 N8 N9 N10 N11 N12 N13 Relative weight at 15 minutes (mg) 1.42 1.20 1.45 2.40 2.12 1.80 2.44 1.61 1.62 2.28 1.70 2.25 2.02 Relative weight at 30 minutes (mg) 1.93 1.52 2.05 2.92 2.89 2.31 2.88 2.31 2.08 2.84 2.14 3.34 2.61 Relative weight at 60 minutes (mg) 3.05 2.35 3.03 3.70 3.85 2.99 3.76 2.80 2.74 3.65 2.52 4.16 3.21 Relative weight at 120 minutes (mg) 4.38 3.13 3.83 5.44 5.34 3.89 4.63 3.39 3.81 4.88 3.45 5.06 4.60 Relative weight at 240 minutes (mg) 6.83 4.43 5.19 7.30 7.90 5.39 6.82 4.54 5.55 7.01 4.88 6.73 6.28 Relative weight at 360 minutes (mg) 8.63 5.54 5.69 8.56 10.01 6.53 8.38 5.29 7.35 8.24 6.26 7.64 7.51 Relative weight at 480 minutes (mg) 9.50 6.34 6.29 9.06 10.91 7.08 9.27 5.61 8.78 8.75 7.44 8.19 8.30 377 FARMACIA, 2008, Vol.LVI, 4 No. exp N16 N17 N18 N19 N20 N21 Relative weight at 15 minutes (mg) 1.22 2.27 1.85 0.91 1.75 3.67 Relative weight at 30 minutes (mg) 1.29 2.96 2.62 0.99 2.01 4.48 Relative weight at 60 minutes (mg) 1.60 4.07 3.98 1.64 2.39 5.30 Relative weight at 120 minutes (mg) 1.92 5.73 5.79 1.93 3.11 7.18 Relative weight at 240 minutes (mg) 5.44 9.34 9.72 2.53 3.58 11.33 Relative weight at 360 minutes (mg) 2.75 11.48 11.46 2.75 4.03 12.33 Relative weight at 480 minutes (mg) 2.99 11.44 12.65 2.73 4.32 12.55 After the individual fitting on Higuchi and Peppas models, Akaike values were calculated for each experimental data. No. exp Higuchi N1 N2 N3 N4 N5 N6 N7 N8 N9 N10 N11 N12 N13 N16 N17 N18 N19 N20 N21 Average -0.8 -22.8 3.3 5.7 -6.9 -0.2 2.4 5.6 -2.5 3.9 -4.2 11.1 -0.7 1.9 7.2 6.1 0.5 8.8 15.3 1.8 Table IV The average Akaike values for each kinetic model Peppas Akaike lower Optimum values model -5.9 -5.9 Peppas -21.0 -22.8 Higuchi -7.2 -7.2 Peppas -3.5 -3.5 Peppas -6.9 Peppas -5.0 -14.7 Peppas -14.7 -2.5 -2.5 Peppas -14.1 Peppas -14.1 -3.6 -3.6 Peppas -5.2 -5.2 Peppas -4.2 Higuchi -2.6 -8.4 -8.4 Peppas Peppas -12.9 -12.9 -21.9 -21.9 Peppas 7.2 Higuchi 9.2 4.5 4.5 Peppas -9.3 -9.3 Peppas Peppas -21.0 -21.0 Peppas 11.4 11.4 -7.0 378 FARMACIA, 2008, Vol.LVI, 4 It is clear that in table V, the Peppas model (M4) is the one which best describes the hydration kinetics for the analyzed samples. For each pharmaceutical formulation, the values of the constant characteristics of the Peppas models were calculated, as well as a parameter, which denotes the precision with which the calculus of the constants is performed (variation coefficient of the standard error of the determination average). No. exp N1 N2 N3 N4 N5 N6 N7 N8 N9 N10 N11 N12 N13 N16 N17 N18 N19 N20 N21 Table V The values valid for Peppas model parameters of the examined pharmaceutical formulation k n 0,309025 0.559745 0,295385 0.496575 0,583372 0.389035 0.755771 0.407748 0.755771 0.407748 0.516062 0.497414 0.556700 0.413889 0.668246 0.347492 0.294055 0.546258 0.698826 0.414059 0.367961 0.481638 0.981416 0.346829 0.592122 0.429197 0.503770 0.287284 0.562846 0.499501 0.422462 0.556996 0.402765 0.321811 0.821988 0.269578 1.166900 0.394624 The exponent (n), indicative of the mechanism of hydration from pharmaceutical formulation, was calculated from the well-known Peppas equation. The values of n were obtained by linear regression analysis. A value of n=0.45 indicates Case I (Fickian) diffusion or square of time kinetics, 0.45<n<0.89 indicates anomalous (non-Fickian) diffusion, n=0.89 indicates Case II transport and n> 0.89 indicates Super Case II transport. [9] In the experimental formulations the exponent n is 0.45<n<0.89, indicating anomalous (non-Fickian) diffusion. FARMACIA, 2008, Vol.LVI, 4 379 CONCLUSIONS 21 hydrophilic matrixes of Hydroxypropyl methylcellulose and Xanthan gum, diclofenacum sodium loaded were formulated and analyzed as the degree of hydration. The hydration profiles of the examined matrix were fitted with 4 kinetic models. The models which best described the hydration kinetics of the matrix formulation was the Peppas model, for which the characteristic parameters have been calculated. In conclusion, Xanthan gum and Hydroxypropil Methylcellulose demonstrated different abilities to hydrate with water. Xanthan Gum displayed a high degree of swelling due to water uptake, in contrast, Hydroxypropil Methylcellulose displayed a much lower hydration capacity. In conclusion Xanthan gums is more hydrophilic than Hydroxypropil Methylcellulose, therefore it hydrates more quickly forming immediately a protective barrier layer. REFERENCES 1. Dale L. Munday, Philip J. Cox, Compressed xanthan and karaya gum matrices: hydration, erosion and drug release mecanism, International Journal of Pharmaceutics, 2000, 203, 179-192 2. I.Kusai, I. Tomuta, S. E. Leucuta, The study of the influence of several formulation variables on “in vitro” release of diclofenac from hydrophilic matrices on basis of Hydroxypropyl Methylcellulose and Xanthan Gum, Farmacia, 2007, 55, 2, 176-184 3. Harland, R.S.Gazzaniga, Colombo, Peppas, Drug polymers matrix swelling and disolution, Pharmaceutical Research, 1995, 5 (8), 488494 4. Edit Laszlo, L. Vlase, S. E. Leucuta, Kinetic modeling of drug release from experimental pharmaceutical gels containing clotrimazole, Farmacia, 2006, 54, 3, 25-32 5. N. Yuksel, A.E. Kanik, T.Baykara, Comparison of in vitro dissolution profiles by ANOVA-based, model-dependent and independent methods, International Journal of Pharmaceutics, 2000, 209, 57-67 6. J.W. Morre, H.H. Flanner, Mathematical Comparison of curves with an emphasis on in vitro dissolution profiles, Pharmaceutical Technology, 1996, 20 (6), 64-74 7. Akaike, H., "A new look at the Statistical Model Identification", IEEE Trans. Automat. Control, 1974, 19, 716-723 380 FARMACIA, 2008, Vol.LVI, 4 8. WinNonlin, Pharsight Inc., Cary, NC, USA, 1998-2002 9. Peppas, Korsmeyer, Mecanism of solute release from porous hydrophylic polimers, International Journal of Pharmaceutics, 1983, 15, 25-35
