2comppd
advertisement
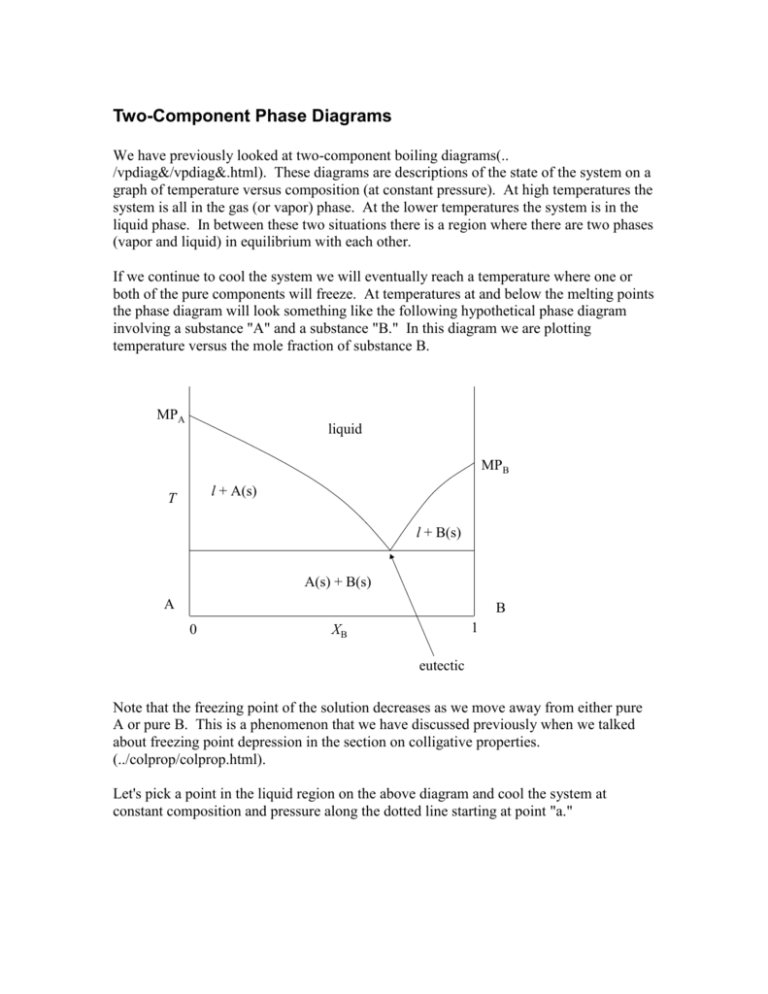
Two-Component Phase Diagrams We have previously looked at two-component boiling diagrams(.. /vpdiag&/vpdiag&.html). These diagrams are descriptions of the state of the system on a graph of temperature versus composition (at constant pressure). At high temperatures the system is all in the gas (or vapor) phase. At the lower temperatures the system is in the liquid phase. In between these two situations there is a region where there are two phases (vapor and liquid) in equilibrium with each other. If we continue to cool the system we will eventually reach a temperature where one or both of the pure components will freeze. At temperatures at and below the melting points the phase diagram will look something like the following hypothetical phase diagram involving a substance "A" and a substance "B." In this diagram we are plotting temperature versus the mole fraction of substance B. MPA liquid MPB l + A(s) T l + B(s) A(s) + B(s) A B 0 1 XB eutectic Note that the freezing point of the solution decreases as we move away from either pure A or pure B. This is a phenomenon that we have discussed previously when we talked about freezing point depression in the section on colligative properties. (../colprop/colprop.html). Let's pick a point in the liquid region on the above diagram and cool the system at constant composition and pressure along the dotted line starting at point "a." a MPA liquid c b MPB l + A(s) T d e f l + B(S) g A(s) + B(s) A B 0 1 XB eutectic Going from point a to point b nothing much happens. We are just cooling the liquid (or melt). At point b, however, we begin to crystallize out some pure component A. When we cross the curved line at point b we are moving into a two phase region. On this diagram the two phases are pure component A and the liquid mixture. As we already know, in a two phase region we must track two different compositions so we draw a tieline. In this case the tie-line runs from point a to point be. Where the tie-line intersects the closed curve at b indicates the composition of the liquid phase. In this diagram the other end of the tie-line intersect the edge of the diagram at pure solid A. As we continue to cool the system the tie-lines track the composition of the liquid and solid phases. by the time we get to point d the left end of the tie-line ef still tracks the pure solid A composition at point e and tracks the liquid composition at point f. Notice that the liquid is much richer in component B. This is because we have been removing component A from the solution by crystallizing it out. When we reach point g the liquid has reached the eutectic composition. At this temperature and liquid composition both pure solid A and pure solid B will crystallize out together. In this phase diagram crystals of the two substances will be interspersed among each other. (The crystals may very well be microscopic so that the mixture looks homogeneous to the naked eye. In this case, the only way to tell that we have a mixture of two different crystals is to examine the solid under a microscope.) If we continue to remove heat from the mixture the system will remain at the eutectic temperature until all of the remaining liquid has solidified. As the temperature decreases at point g the system crosses over into another two phase region. This time the two phases in equilibrium are pure solid A and pure solid B. Tielines in this region (which we have not drawn) run from the pure A side to the pure B side. The Gibbs phase rule (../gibbspr/gibbspr.html) tells us the variance in the various regions. Since this is a two-component system the variance is given by v = 2 + c p = 4 p. One of the degrees of freedom contributing to the variance is pressure, but since pressure is constant in this diagram we have to regard pressure as being plotted perpendicular to the plane of the screen. It is usual to define the "reduced variance," v', as just the variance in the plane of the diagram. That is, the reduced variance is the phase rule variance minus the pressure variable. The reduced variance is given in a two-component phase diagram by v' = 3 p. In the above diagram the reduced variance is 2 in the liquid region. (You can change temperature and composition arbitrarily over a reasonable range.) In the twophase regions, like the A(s) + liquid, or B(s) + liquid, regions the reduced variance is 1. In these regions if you change the temperature the composition of the liquid phase must change. (Although the composition of the solid phase will not change in these cases because the solid phase is pure A or pure B.) Solid/Solid Solubility In many cases when we cool the melt to its "freezing point" it is not one of the pure components that crystallizes out, but a solid solution. A solid solution has many of the characteristics of a liquid solution except that it is solid. The primary similarity is that in a solid solution the "solute" is distributed homogeneously throughout the "solvent" as atoms or molecules (not as microcrystals). On the diagram below the region labeled (s) is a solid solution of B in A. That is, component A would be regarded as the solvent and B as the solute. Some people would refer to this phase as "impure A." Likewise, the region labeled (s) is a solid solution of A in B. It could also be regarded as impure B. MPA liquid MPB T (s) l + (s) l + (s) (s) (s) + (s) A B 0 1 XB eutectic The reduced variance in the solid solution regions labeled (s) and (s) is 2 because these regions are one-phase regions. The reduced variance in the other regions is the same as in the phase diagram with no solid-solid solubility. On this diagram it is easier to see why the reduced variance is 1 in the region labeled (s) + (s). The composition of the two solid solution phases in equilibrium changes slightly as the temperature is changed. Silver and copper form solid-solid solutions similar to the above diagram where the solidsolid solubility of one component in the other is not very large. Diffusion in solids is very slow at room temperature. Diffusion is much faster at temperatures near the melting points of the components. There is a sculpture in a Manhattan park entitled 3000 A. D. Aluminum/Magnesium by Terry FugateWilcox. It is a spire of alternating pieces of aluminum and magnesium. Presumably solid-solid diffusion will transform the sculpture into a homogeneous solid-solid solution of aluminum and magnesium by the year 3000. Compound Formation 1 4 2 3 T 7 8 5 9 10 11 6 12 A B 0 XB 1 The above phase diagram shows the formation of a compound between A and B. The compound is shown by the vertical line from point 3. You can tell the formula of the compound from its composition, XB. It looks like the compound has a mole fraction of B of 1/3. That means that in the compound, XB nB 1 . nA nB 3 To find the formula of the compound we look for the smallest whole numbers for nA and nB which will satisfy this equation. In this case it looks like the equation is solved by setting nB = 1 and nA = 2. Then, XB nB 1 1 , nA nB 2 1 3 so the formula of the compound is A2B. The diagram is labeled as follows: 1 = liquid 2 = MP of A 3 = MP of compound A2B 4 = MP of B 5 = eutectic of A and A2B 6 = eutectic of A2B and B 7 = A(s) + liquid 8 = liquid + A2B(s) 9 = A2B(s) + liquid 10 = liquid _ A2B(s) 11 = A(s) + A2B(s) 12 = A2B(s) + B(s) Incongruent Melting Point (melting with decomposition) 4 1 2 7 T 3 5 8 9 6 11 10 0 XB 1 This phase diagram shows an incongruent melting point. The vertical line at point 5 represents formation of a compound. It looks like the composition of the compound is XB = 2/3, from which we conclude using the previous arguments, XB 2 nB 2 , 3 nA nB 1 2 so that the compound is AB2. Point 5 is the melting point of AB2, but notice that melting AB2 does not give liquid of the same composition. Rather, melting of AB2 gives liquid with the composition at point 3 and pure B(s). So the compound, AB2 , melts and decomposes at the same time. An analysis of the points and regions is: 1 = liquid 2 = MP of A 3 = the peritectic point (we don’t get a eutectic of AB2 and B) 4 = MP of B 5 = the incongruent melting point of AB2 6 = eutectic of A and AB2 7 = liquid + B(s) 8 = B(s) and liquid 9 = liquid and AB2(s) 10 = A(s) + AB2(s) 11 = AB2(s) + B(s) Other Possibilities There are many possible variations and combinations possible with these themes. For example, Or even more interesting, We will leave it to the reader to understand and analyze these two hypothetical phase diagrams. Phase diagrams – some much more complicated than the examples presented here, are very important in areas such as metallurgy, materials science, geology and geophysics, planetary science, and many more. Some of the most important ones involve more than two components. These are beyond the scope of the present discussion. Cooling Curves It is fair to ask what kind of experimental data it takes to determine the phase diagram of a two-component system. One such data set comes from cooling curves. To make a cooling curve you start with liquid at some composition. Then you allow it to cool slowly and measure the temperature as a function of time. (You want it to cool slowly so that the system has time to establish equilibrium at each temperature. This may be hard to do because physical and chemical processes involving solids can be very slow. Nevertheless, you would like to be as close to equilibrium as you can be.) If you start at the composition of a pure compound then the system cools relatively rapidly until you come to the melting point of the compound. At the melting point the temperature holds steady at the melting temperature until all the liquid has been converted to solid. This is called a “halt.” Then the temperature drops rapidly again. The same thing happens at the composition of a eutectic. The temperature drops relatively rapidly until you hit the eutectic melting point and then “halts’ until all the liquid has been converted to solid, then the temperature drops rapidly again. If you start at a composition between a pure compound and the eutectic the temperature drops relatively rapidly until you hit the temperature of one of the solid/liquid phase boundaries. At this point the mixture continues to cool, but much more slowly because the system is gradually precipitating out a pure compound as it cools and the heat of fusion must be dissipated in order for the system to cool. T XB time The diagram above shows, on the left, a simple hypothetical phase diagram (substance A with substance B). On the right there is a set of coordinate axes for a plot of temperature versus time (using the same temperature scale). Since this stupid Microsoft Word/Powerpoint combination will not let me place all the cooling curves on one graph I will show you five graphs of cooling curves at different compositions. The first cooling curve will be for pure A: 1 1 T XB time As we cool pure liquid A nothing much happens until we reach the melting point of A. At the melting point of A the curve takes a "halt." That is, the temperature holds constant until all of the liquid has been converted into solid. The temperature stays constant for a period of time because our cooling mechanism, whatever it is has to remove the heat of fusion which is given off when the liquid is convert into solid. When all of the liquid has been converted to solid we begin cooling the solid and nothing else of interest happens (unless there is some solid-solid phase transition at a lower temperature which is not shown on our graph.) Our second cooling curve will be for a mixture with composition between pure A and the eutectic. 2 2 break T XB time On this cooling curve we have a break (change in slope) at the point where A(s) begins to precipitate out. The system cools slower at the break because A(s) is precipitating (freezing) out and the heat of fusion being released in this process must be dissipated in addition to the heat removed in simply lowering the temperature. The next cooling curve will be at the composition of the eutectic. Nothing happens until we reach the melting point of the eutectic, at which point the temperature remains constant until all of the material has solidified. 3 3 T eutectic halt XB time Our fourth cooing curve will be at a composition between the eutectic and pure B. We expect to see a break at the point where the temperature crosses the liquid/solid phase boundary and a halt at the melting point of the eutectic. 4 T XB time And we do. Cooling curve will be for pure B. 5 5 T XB time All we get for the cooling curve of pure B is a halt at the melting point of B. It is not so much of interest to go from the phase diagram to a set of cooling curves (although you should be able to do that). The main interest is to get the phase diagram from a set of cooling curves. Experimental data is often in the form of a set of cooling curves (or even in a specification of the breaks and halts at different compositions). From this data one can construct the phase diagram.
