SUPPLEMENTAL FIGURES
advertisement
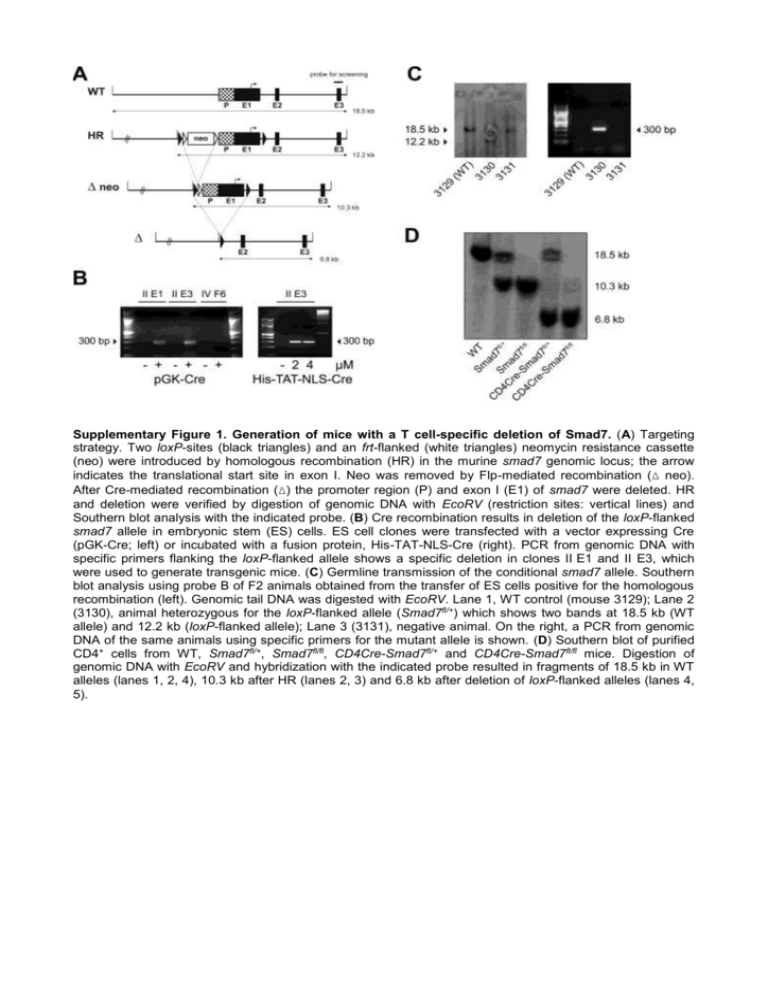
Supplementary Figure 1. Generation of mice with a T cell-specific deletion of Smad7. (A) Targeting strategy. Two loxP-sites (black triangles) and an frt-flanked (white triangles) neomycin resistance cassette (neo) were introduced by homologous recombination (HR) in the murine smad7 genomic locus; the arrow indicates the translational start site in exon I. Neo was removed by Flp-mediated recombination (Δ neo). After Cre-mediated recombination (Δ) the promoter region (P) and exon I (E1) of smad7 were deleted. HR and deletion were verified by digestion of genomic DNA with EcoRV (restriction sites: vertical lines) and Southern blot analysis with the indicated probe. (B) Cre recombination results in deletion of the loxP-flanked smad7 allele in embryonic stem (ES) cells. ES cell clones were transfected with a vector expressing Cre (pGK-Cre; left) or incubated with a fusion protein, His-TAT-NLS-Cre (right). PCR from genomic DNA with specific primers flanking the loxP-flanked allele shows a specific deletion in clones II E1 and II E3, which were used to generate transgenic mice. (C) Germline transmission of the conditional smad7 allele. Southern blot analysis using probe B of F2 animals obtained from the transfer of ES cells positive for the homologous recombination (left). Genomic tail DNA was digested with EcoRV. Lane 1, WT control (mouse 3129); Lane 2 (3130), animal heterozygous for the loxP-flanked allele (Smad7fl/+) which shows two bands at 18.5 kb (WT allele) and 12.2 kb (loxP-flanked allele); Lane 3 (3131), negative animal. On the right, a PCR from genomic DNA of the same animals using specific primers for the mutant allele is shown. (D) Southern blot of purified CD4+ cells from WT, Smad7fl/+, Smad7fl/fl, CD4Cre-Smad7fl/+ and CD4Cre-Smad7fl/fl mice. Digestion of genomic DNA with EcoRV and hybridization with the indicated probe resulted in fragments of 18.5 kb in WT alleles (lanes 1, 2, 4), 10.3 kb after HR (lanes 2, 3) and 6.8 kb after deletion of loxP-flanked alleles (lanes 4, 5). Supplementary Figure 2. T cell-specific deletion of Smad7 in CD4Cre-Smad7fl/fl mice. (A and B) qRTPCR analysis of Smad7-mRNA in the indicated cell populations from WT, Smad7fl/fl and CD4Cre-Smad7fl/fl mice (n=2). Expression is presented relative to 18S-RNA and normalized on WT CD90.2+ (A) or WT CD4+CD11b+/CD11c+ (B) cells (= 1.0 arbitrary units). CD90.2+ T lymphocytes were purified by MACS isolation and negative fractions used for FACS sorting to isolate CD4+ and CD4- CD11b+ monocytes or CD11c+ dendritic cells, respectively. (C) Southern blot of MACS-purified CD4+, CD11c+ and CD19+ cells from Smad7fl/fl and CD4Cre-Smad7fl/fl mice. Genomic DNA was digested with EcoRV and hybridized with a specific probe, which resulted in fragments of 10.3 kb in alleles without and 6.8 kb in alleles with recombination, respectively. Purity of MACS-isolated cell populations was checked by FACS and was > 90%. Supplementary Figure 3. Additional EAE data. (A) Proliferation of T cells with Smad7 overexpression. CD2-Smad7 and WT mice were immunized with MOG(35-55) and organs dissected 16 days later. Splenocytes were restimulated in RPMI with increasing concentrations of MOG(35-55) or ConA, respectively, for 96 h. Proliferation was measured by thymidine-incorporation. Data are expressed as the mean + SD from triplicates and are representative for two experiments with 5 animals per group. (B) ELISA measuring IL-10 from supernatants of splenocytes after 5 days MOG(35-55)-restimulation. Shown is mean + SEM of 2-3 independent experiments. (C) Peripheral T cell populations after EAE induction. Spleens and draining LNs were dissected 14 days after induction of EAE and analyzed by flow cytometry for total T cells (CD90.2+), CD4+ and CD8+ T cells and memory T cells (CD44 highCD62Llow). Populations were gated on and are shown as percentage of: all lymphocytes (total T cells), CD90.2 + T cells (CD4+ and CD8+) and CD4+ T cells (memory T cells), respectively. Data are representative of 2 independent experiments, the error bars indicate SD of 3 animals per group. (D) Draining LNs from MOG(35-55)-immunized mice were dissected at day 16 and analyzed by flow cytometry for CD44highCD62Llow memory T cells, CD44lowCD62Lhigh naïve T cells and FoxP3+ T reg cells (n=5 mice per group). Cells are gated on CD4 + cells. Upper panel: analysis of pooled cells, lower panel: representative examples of single mice are shown. (E) Percentage of T reg cells (FoxP3+) in the CD4+ gate, spleens were dissected 14-16 days after immunization with MOG(35-55). Shown is mean + SEM of 3-4 independent experiments.
