Data Analysis Notes
advertisement
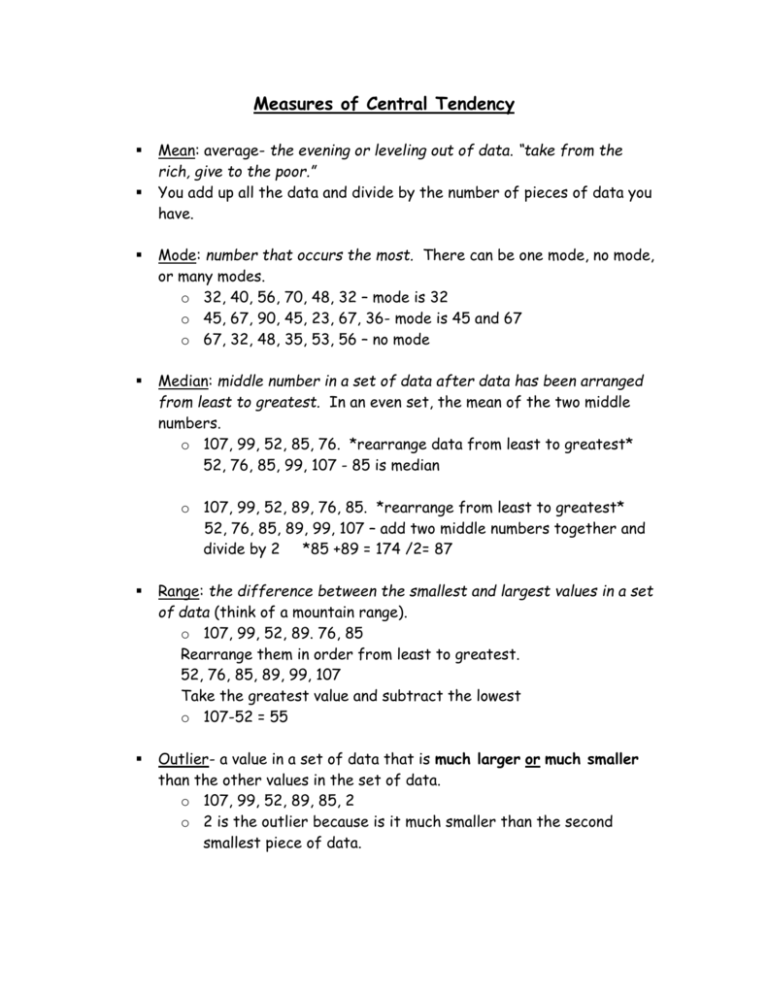
Measures of Central Tendency Mean: average- the evening or leveling out of data. “take from the rich, give to the poor.” You add up all the data and divide by the number of pieces of data you have. Mode: number that occurs the most. There can be one mode, no mode, or many modes. o 32, 40, 56, 70, 48, 32 – mode is 32 o 45, 67, 90, 45, 23, 67, 36- mode is 45 and 67 o 67, 32, 48, 35, 53, 56 – no mode Median: middle number in a set of data after data has been arranged from least to greatest. In an even set, the mean of the two middle numbers. o 107, 99, 52, 85, 76. *rearrange data from least to greatest* 52, 76, 85, 99, 107 - 85 is median o 107, 99, 52, 89, 76, 85. *rearrange from least to greatest* 52, 76, 85, 89, 99, 107 – add two middle numbers together and divide by 2 *85 +89 = 174 /2= 87 Range: the difference between the smallest and largest values in a set of data (think of a mountain range). o 107, 99, 52, 89. 76, 85 Rearrange them in order from least to greatest. 52, 76, 85, 89, 99, 107 Take the greatest value and subtract the lowest o 107-52 = 55 Outlier- a value in a set of data that is much larger or much smaller than the other values in the set of data. o 107, 99, 52, 89, 85, 2 o 2 is the outlier because is it much smaller than the second smallest piece of data. Creating a Set of Data for a Given Mean Provide 5 pieces of data for a mean of 25 25 25 25 25 25 -5 -8 +5 +6 +2 20 17 30 31 27 New data set whose mean is 25: 20, 17, 30, 31, 27 Method 1: Multiply the given mean by the # of pieces of data o 25 x 5 = 125 After you have EQUALLY added and subtracted from the given numbers, add up the values from the new data set and make sure that they have the same answer as the 25 x 5= 125 o 20 + 17 + 30 + 31 + 27 = 125 Method 2: Multiply the given mean by the number of pieces of data. o 25 x 5 = 125 You can split the number you get into any combination of 5 numbers that add up to it (125). Example 1: 70 15 10 5 20 Example 2: 40 35 25 15 10 Constructing a Line Plot (DADD) A line plot is a display of data on a horizontal line (x-axis). The data is displayed vertically with Xs. You can visualize clusters/groups Mode is easily seen EXAMPLE: The children in Ms. Storz’s class were polled to find the number of siblings they had. Data: 4, 2, 1, 1, 2, 3, 4, 5, 4, 4, 2, 2, 5, 3, 3, 2, 7 3). Arrange data in order from least to greatest: 1, 1, 2, 2, 2, 2, 2, 3, 3, 3, 4, 4, 4, 4, 5, 5, 7 4). When you put the Xs on the line plot- they have to be the same size and spaced the same. Ms. Storz’s Class X X X X X X X X X X X X X X X X 1 2 3 4 5 Number of Siblings X 6 7 Constructing a Line Plot (DADD) Draw a horizontal line with arrows to display the data (x-axis) – line plots above and below do not have arrows but you must include them. Assign a title (both the graph and the x-axis) Determine the RANGE of data (minimum and maximum) Place ALL numbers on the line (even if not in the data). Equally space out the numbers and arrows. Draw an X above the corresponding data (x – same size) Measures of Central Tendency from a Line Plot Ms. Storz’s Class Siblings X X X X X X X X X X X X X X X X 1 2 3 4 5 X 6 7 Number of Siblings Mode: Tallest Tower - 2 Median: cross off high, low until you get to the middle - 3 Range: subtract the lowest value from the highest o 7-1=6 Range= 6 Mean: 1. Multiply the number of Xs by the given data value (Data Value) x (number of Xs) 1 x2= 2 2 x 5= 10 4x4= 16 5x2= 10 3 x 3= 9 7x1=7 2. The add all the values together. 1+ 10+ 9+ 12+ 10 + 7 = 49 3. Then divide the sum by the number of Xs. 49 ÷ 17 = 2.88 Constructing a Stem and Leaf Plot (SMACK) Sequence Data (in order from least to greatest) Make an outline Assign a title Chart stem and leaf values (in order/ line up vertically) Key Example: Ms. Storz’s students scored the following on their recent math test: 97, 65, 87, 75, 84, 95, 92, 74, 83, 87, 91, 76, 80, 68, 87, 90, 76, 90, 92, 87 Construct a Stem and Leaf Plot to display the scores. 1. Sequence Data: 65, 68, 74, 75, 76, 76, 80, 83, 84, 87,87,87,87, 90,90,91,92, 92, 95,97. 2. Make an outline. 3. Assign a title 4. Chart stem and leaf values: determine stems by finding the least and greatest tens. All possible stems must be included 5. Key Ms. Storz’s Class Math Test Scores Stems (10s) Leaves (1s) 6 7 8 9 5 4 0 0 8 5 6 6 3 4 7 7 7 7 0 1 2 2 5 7 Key 6 5 means 65 Calculating the Measures of Central Tendency (MCTs) from a Stem and Leaf Plot RANGE = (Largest Value) – (Smallest Value) Largest Value: find the largest STEM and go out to the largest LEAF in that column Smallest Value: Find the smallest STEM and the LEAF that is closest to the stem (smallest digit number) 79 – 30 = 49 Range = 49 MODE = find the LEAF that appears most often in A ROW. REMEMBER, that digit is NOT the actual value. Make sure you match up your leaf (1s) with it’s stem (10s) to get the true value. Mode = 56 MEDIAN = HIGH, LOW. You go from the highest LEAF to the lowest LEAF. DO NOT include the stems when you are crossing off numbers! MEDIAN = 56 MEAN = You have to ADD UP all the VALUES (remember to match up the leaf with its stem to get its TRUE VALUE) and DIVIDE by the number of LEAVES. Find the value of each row of data Add all the rows together 64 Divide by the number of leaves 130 226 839 ÷ 15 = 55.93 261 Quiz Scores + 158 839 Stems (10s) 3 4 5 6 7 Leaves (1s) 0 1 6 2 9 4 64 2 7 130 6 6 8 226 5 5 9 261 9 158 Key 4 1 means 41 Mean = 55.93 Back to Back Stem and Leaf Plot Compares two sets of similar data. One side “versus” the other. Both the right and left sides share the stems. Right side is just like a regular stem and leaf plot; the left side is a “mirror image” of the right. TWO KEYS Leaves are labeled by the two things being compared. Still use S.M.A.C.K. to construct the line plot. Ms. Storz’s Class Number of Snaps in 30 Seconds Left Side Right Side 60 69 97 81 59 59 58 72 64 67 62 32 66 58 69 61 61 62 53 80 75 64 62 63 77 75 53 62 65 65 65 67 49 67 50 64 58 66 41 56 46 79 69 85 Sequence Data: Sequence Data: 32, 53, 58, 58, 59, 59, 60, 61, 61, 62, 62, 41, 46, 49, 50, 53, 56, 58, 62, 62, 63, 64, 64, 64, 66, 67, 69, 69, 72, 75, 80, 81, 97 65, 65, 65, 66, 67, 67, 69, 75, 77, 79, 85 Ms. Storz’s Class Number of Snaps in 30 Seconds Left Hand Stems 2 9 9 8 8 3 9 9 7 6 4 4 2 2 1 1 0 5 2 1 0 7 Key 2 3 means 32 3 4 5 6 7 8 9 Right Hand 1 0 2 5 5 6 9 3 6 8 2 3 4 5 5 5 67 7 9 7 9 85 Key 4 1 means 41 Ms. Storz’s Class Number of Snaps in 30 Seconds Left Hand Stems 2 9 9 8 8 3 9 9 7 6 4 4 2 2 1 1 0 5 2 1 0 7 Key 2 3 means 32 Left Side: Mean: _____ Median: 64 Mode: 58, 59, 61, 62, 64, 69 Range:97-32= 65 3 4 5 6 7 8 9 Right Hand 1 6 9 136 0 3 6 8 214 2 2 3 4 5 5 5 6 7 7 9715 5 7 9 231 5 85 MEAN 136 214 Key 4 1 means 41 715 231 + 85 1,381 Right Side: Mean: 62.78 1,381 ÷ 22= Median: 64.5 62.78 Mode: 65 Range: 85-41= 44


