Mapping
advertisement
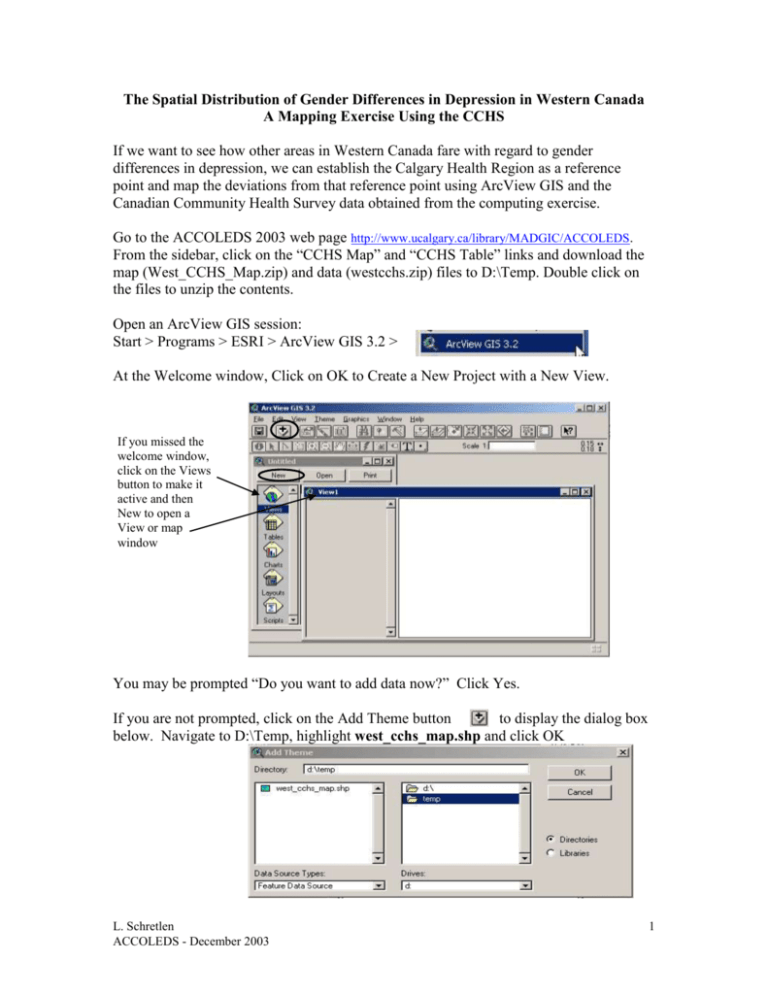
The Spatial Distribution of Gender Differences in Depression in Western Canada A Mapping Exercise Using the CCHS If we want to see how other areas in Western Canada fare with regard to gender differences in depression, we can establish the Calgary Health Region as a reference point and map the deviations from that reference point using ArcView GIS and the Canadian Community Health Survey data obtained from the computing exercise. Go to the ACCOLEDS 2003 web page http://www.ucalgary.ca/library/MADGIC/ACCOLEDS. From the sidebar, click on the “CCHS Map” and “CCHS Table” links and download the map (West_CCHS_Map.zip) and data (westcchs.zip) files to D:\Temp. Double click on the files to unzip the contents. Open an ArcView GIS session: Start > Programs > ESRI > ArcView GIS 3.2 > At the Welcome window, Click on OK to Create a New Project with a New View. If you missed the welcome window, click on the Views button to make it active and then New to open a View or map window You may be prompted “Do you want to add data now?” Click Yes. If you are not prompted, click on the Add Theme button to display the dialog box below. Navigate to D:\Temp, highlight west_cchs_map.shp and click OK L. Schretlen ACCOLEDS - December 2003 1 Click on the box beside the map file name to make the map viewable . ArcView opens the map with default colours showing the health region boundaries for the four Western provinces. Click on the theme to ensure it is active (it looks raised when active). Open the map’s attribute table by clicking on the Open table button. Locate the Pr_hruid field. This is the field that will match with the new geo-coded variable in the CCHS data file. Notice that there are duplicate codes indicating multiple polygons or areas representing one health region. The codes are not in numeric order, so we will sort them in ascending order. Click on the Pr_huid field name to activate it, then Click on the ascending sort button. Ascending Sort button L. Schretlen ACCOLEDS - December 2003 2 Scroll down the Pr_hruid column until you see codes starting with 47xx (Province code for Saskatchewan). In order to map the data from the CCHS, we will have to make adjustments to the boundary file for Saskatchewan. In the computing exercise, you have already determined from the Derived Variables in the CCHS codebook that some geographic areas have been collapsed. The attribute table codes can be edited to match the geo-codes in the CCHS data. We will bring in the CCHS data to see how the tables compare. If necessary, move the map window and resize the attribute table so you can view the project window. Project window Click on the Tables button to activate it, then the Add button to bring in the CCHS data Navigate to D:\Temp, click on westcchs.dbf, then click OK. Arrange the tables so you can see both tables side by side. On the westcchs.dbf table, click on the Pr_hruid field title to select it and then click on the Sort button to sort it ascending like you did with the attribute table. See the graphic on the next page. L. Schretlen ACCOLEDS - December 2003 3 Locate the Saskatchewan Health Regions, 47xx codes, in the map attribute table. Compare these to the 47xx codes in the CCHS Data table. There are some regions listed in the Health Regions Map attribute table that are not listed in the CCHS data Table. CCHS Data table Health Regions Map attribute table Health Region codes that need to be edited For more information on the Health Region geography in the CCHS see the following documents, available online at http://www.statcan.ca/english/Dli/Data/Ftp/cchs/cchs.htm: CCHS PUMF Data Dictionary, page 4, which lists the 6 health regions for Saskatchewan CCHS Derived Variable Document on Geographic Variables, page 6, which explains and describes the collapsing of some regions. The Derived Variable Document provides you with the information you need to edit the attribute table. Remember, in the computing exercise, the middle “9” was removed from the data output. L. Schretlen ACCOLEDS - December 2003 4 To begin editing the map attribute table, Click on its title bar to make the table active. Go to the Menu bar, select Table > Start Editing. Re-sort the attribute table in ascending order again so the codes are easy to find. Turn on the Edit button. . In the Pr_huid column click on each cell that needs to be edited, type in the new value and press enter. Continue through the column. When you are done with the changes, go back to the Menu bar , click on Table > Stop Editing. You will be prompted “Save Edits”, say Yes. Sort the Pr_huid column again. The edited attribute table should look like this graphic. L. Schretlen ACCOLEDS - December 2003 5 You are now ready to join the CCHS data to the Health Regions map. On both tables make sure the Pr_huid field is active or highlighted. Click on the title bar of the attributes table to make it the destination table for the join. Click on the Join button. The data table will disappear. Scroll across the map attributes table. You should see eight new columns containing the CCHS data. Scroll down to health region code 4709. Notice that there is no data for that region. Now we are ready to map the CCHS variables. Go to the Menu bar. Click on Window > View1 to make the map window viewable. You can also open the map window by clicking on the Project window, Click on Views, highlight View1 and click Open L. Schretlen ACCOLEDS - December 2003 6 To create a thematic map based on the CCHS data, we need to use the Legend Editor. Double click on the map layer theme. This will bring up the Legend Editor dialog box. For Legend Type, select Graduated Colour For Classification field select Depdiff from the drop-down box L. Schretlen ACCOLEDS - December 2003 7 A default five class legend is displayed. We want to customize it to display six classes. Click on the Classify button For Number of classes select 6. Click OK. Next, we want to edit the values for the 6 classes to reflect specific ranges. Click in each box under Value and enter the following values: -0.55 1.24 3.04 4.84 6.64 8.44 - 1.24 3.04 4.84 6.64 8.44 10.25 Note: We are using the Calgary Health Region as the focal comparison unit and adjusting every other Health Region in terms of standard deviation units from Calgary. The overall standard deviation for the gender-difference variable is 1.8. This makes the anchor interval Calgary Health Region plus and minus 0.9. See the graphic on the next page illustrating the changed values. L. Schretlen ACCOLEDS - December 2003 8 You will recall there was one Health Region with no data. To represent this missing data on the map, click on the Null value button to include a No Data Label. Check the box to Include No Data Class in Legend Click OK Double click on the symbol box in the No Data class to bring up the Fill Palette, click on the paint brush and select a light grey to illustrate No Data, close the Colour Palette, then click Apply. L. Schretlen ACCOLEDS - December 2003 9 Your map should look something like the one below. You could now export your map as a graphic to use in a word processing document or Powerpoint presentation. Go to File > Export > Select a file type like jpg or wmf, give the file a name, click OK. For bonus points, however, you might want to adjust the map colours to better illustrate how gender differences in depression deviate from the Calgary HR in Western Canada. Double click on the theme legend to bring up the Legend Editor again. Browse through the colour ramps. Select one of the dichromatic ramps like “Greens to Oranges”. For an example of how this might look, see the CCHS Sample link on the ACCOLEDS 2003 web page http://www.ucalgary.ca/library/MADGIC/ACCOLEDS. For extra bonus points, you might want to edit the polygons on the map to more accurately reflect the aggregating of the health regions in the CCHS. If your audience were to examine Saskatchewan closely, they might interpret the map to mean that the three polygons on the south border have distinct values in the 1.24 – 3.04 range when, in fact, there is only one value for these health regions as a whole. L. Schretlen ACCOLEDS - December 2003 10 To edit the polygons, Click on the map window to make it active. On the Menu bar select Theme > Start Editing. Click on one of the polygons on the south border (4701), then hold down the shift key while you click on the other two polygons to select all three. Release the shift key, then on the Menu bar select Edit > Union Features. On the Menu bar go to Theme > Stop Editing, say Yes to “Save edits?” You should see the polygon boundaries disappear between the three Health Regions. Edit regions 4705, 4707, and 4709 in the same manner. Unedited map polygons (11) Edited map polygons (6) Other finishing touches you might make would include changing the View1 title to something more meaningful. On the Menu bar click on View > Properties > type “Distribution of Gender Differences in Depression in the West”. Click OK. The theme label can be edited in a similar manner. On the Menu bar click on Theme > Properties > for Theme Name, type “Gender Differences”, and click OK. L. Schretlen ACCOLEDS - December 2003 11 Now that you are finished, export your map as a graphic. From the Menu bar, click on File > Export, select a file type (jpg or wmf) and name your file. You can also print directly from ArcView under File > Print. Well done!! Notes on sources: The geography file, west_cchs_map.shp, used for this exercise is composed of: British Columbia health regions from the Health Regions Boundary Files 2003 available from: http://www.statcan.ca/english/freepub/82-402-XIE/00503/region.htm Alberta, Saskatchewan, and Manitoba health regions from the Health Regions 2000 CD-ROM, Catalogue No.: 82F0082XCB available through the DSP. West_cchs_map.shp has been edited for B.C., Alberta, and Manitoba, leaving Saskatchewan unedited for this exercise. L. Schretlen ACCOLEDS - December 2003 12

