NASAProposal - Emanuele Di Lorenzo
advertisement
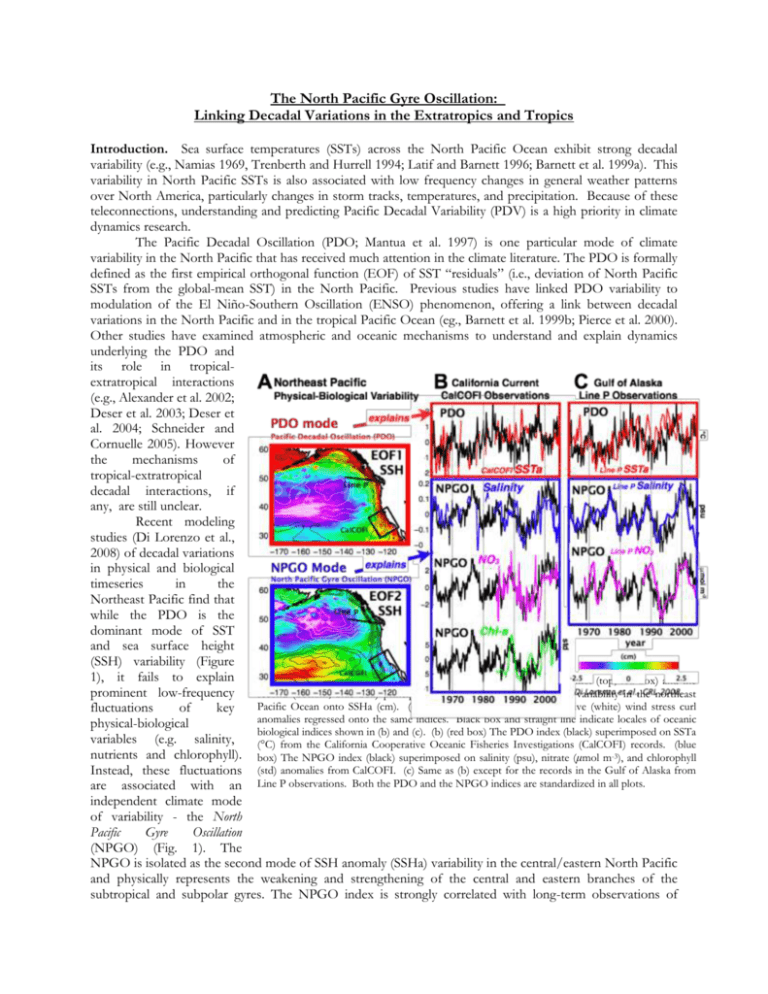
The North Pacific Gyre Oscillation: Linking Decadal Variations in the Extratropics and Tropics Introduction. Sea surface temperatures (SSTs) across the North Pacific Ocean exhibit strong decadal variability (e.g., Namias 1969, Trenberth and Hurrell 1994; Latif and Barnett 1996; Barnett et al. 1999a). This variability in North Pacific SSTs is also associated with low frequency changes in general weather patterns over North America, particularly changes in storm tracks, temperatures, and precipitation. Because of these teleconnections, understanding and predicting Pacific Decadal Variability (PDV) is a high priority in climate dynamics research. The Pacific Decadal Oscillation (PDO; Mantua et al. 1997) is one particular mode of climate variability in the North Pacific that has received much attention in the climate literature. The PDO is formally defined as the first empirical orthogonal function (EOF) of SST “residuals” (i.e., deviation of North Pacific SSTs from the global-mean SST) in the North Pacific. Previous studies have linked PDO variability to modulation of the El Niño-Southern Oscillation (ENSO) phenomenon, offering a link between decadal variations in the North Pacific and in the tropical Pacific Ocean (eg., Barnett et al. 1999b; Pierce et al. 2000). Other studies have examined atmospheric and oceanic mechanisms to understand and explain dynamics underlying the PDO and its role in tropicalextratropical interactions (e.g., Alexander et al. 2002; Deser et al. 2003; Deser et al. 2004; Schneider and Cornuelle 2005). However the mechanisms of tropical-extratropical decadal interactions, if any, are still unclear. Recent modeling studies (Di Lorenzo et al., 2008) of decadal variations in physical and biological timeseries in the Northeast Pacific find that while the PDO is the dominant mode of SST and sea surface height (SSH) variability (Figure 1), it fails to explain FIG. 1. From Di Lorenzo et al. 2008. (a) (shading) Regression of the first (top; red box) and the prominent low-frequency second (bottom; blue box) principal component time series of SSHa variability in the northeast Pacific Ocean onto SSHa (cm). (contours) Positive (black) and negative (white) wind stress curl fluctuations of key anomalies regressed onto the same indices. Black box and straight line indicate locales of oceanic physical-biological biological indices shown in (b) and (c). (b) (red box) The PDO index (black) superimposed on SSTa variables (e.g. salinity, (°C) from the California Cooperative Oceanic Fisheries Investigations (CalCOFI) records. (blue nutrients and chlorophyll). box) The NPGO index (black) superimposed on salinity (psu), nitrate (μmol m-3), and chlorophyll Instead, these fluctuations (std) anomalies from CalCOFI. (c) Same as (b) except for the records in the Gulf of Alaska from are associated with an Line P observations. Both the PDO and the NPGO indices are standardized in all plots. independent climate mode of variability - the North Pacific Gyre Oscillation (NPGO) (Fig. 1). The NPGO is isolated as the second mode of SSH anomaly (SSHa) variability in the central/eastern North Pacific and physically represents the weakening and strengthening of the central and eastern branches of the subtropical and subpolar gyres. The NPGO index is strongly correlated with long-term observations of salinity and nutrients in the California Current and Gulf of Alaska, which have been previously unexplained. Similar to the PDO, the NPGO has a global-scale signature in both SST anomalies (SSTa) and SSHa (Figure 2), including an equatorially-symmetric pattern. This symmetric structure in SSTs suggests that the tropics are involved in explaining the NPGO. This result allows us to develop new hypotheses of mechanisms of decadal tropicalextratropical interactions, which are presented below and will be tested in this proposed research. FIG. 2. From Di Lorenzo et al. (2008). Correlation of global SSHa from satellite altimerty and global SSTa from the Smith and Reynolds (2004) dataset with the NPGO index. Note the equatorially symmetric pattern in both correlation maps. Linking the NPGO to other modes of variability in the North Pacific. The NPGO can be linked to extratropical atmospheric variability in the North Pacific. The North Pacific extratropical atmosphere is characterized by relatively low sea level pressure (SLP) across the far north (in the vicinity of the Aleutian Low) and relatively high pressure in the subtropical Pacific Ocean (e.g., near Hawaii). SLP anomalies (SLPa) between this two regions constitute the North Pacific Oscillation (NPO), as first identified by Walker and Bliss (1932) and later by Rogers (1981,1990). The corresponding wind stresses associated with this dipole in SLP forces the NPGO SSHa dipole in the northeast Pacific Ocean. Hence, the NPGO is the oceanic expression of the NPO. To see this, we reconstruct the NPGO index using an autoregressive lag-1 (AR-1) model forced by the NPO index: NPGO(t+1) = αNPGO(t) + γNPO(t)dt, where is the lag-1 autocorrelation and is the coefficient of the forcing (the NPO) found by least-squares fitting. When we use this AR-1 model (see Figure 3b), the reconstructed NPGO index closely tracks the NPGO index, suggesting FIG. 3. (a) The NPO index (standardized), represented as SLPa at Hawaii. (b) The in fact that the extratropical NPGO index (black; standardized) and the reconstructed NPGO index (green) from the atmosphere in the North Pacific AR-1 model, forced only with the NPO index in (a) (r = 0.71, which is significant at the 99% level). (c) The NPGO index (black) and the KOE index (red; Taguchi et al. 2007), forces the oceanic SSHa pattern. lagged by 3 years (i.e., the NPGO leads the KOE by 3 years). The adjustment process of the northeast Pacific Ocean to NPGO SSHa consequently excites westward-propagating oceanic Rossby waves. As these waves reach the western boundary they modulate decadal variability in the Kuroshio-Oyashio Extension (KOE; Qiu 2000, 2002; Taguchi et al. 2007). This view is supported by Fig. 3c that shows strong correlation between the NPGO index and the KOE index lagged by 3 years (i.e., the NPGO index leads the KOE index by 3 years). Hence, variability in the northeast Pacific associated with the NPGO can be tied to the KOE with a common driving mechanism -- the NPO. Extratropical-Tropical Interactions. The oceanic expression of the NPO (i.e. the NPGO) exhibits a global-scale equatorially-symmetric expression of SSTa and SSHa (Fig. 2) suggesting a link between the tropics and extratropics. Previous studies have shown that NPO can affect the tropical Pacific Ocean by imposing long-lasting SSTa on the subtropical ocean which then feedback onto the overlying atmosphere in an ENSO-like manner (i.e., the seasonal footprinting mechanism; Pierce et al. 2000; Vimont et al. 2001, 2003). Figure 4 (middle and bottom rows) clearly describe this type of footprinting sequence. The lag 0 correlations (Fig. 4, middle panels) show both the NPO (in SLPa) and the NPGO signature in the northeast Pacific Ocean (in SSTa). In the following boreal winter (Fig. 4, bottom row), a clear ENSO-like signature is evident, with a dipole in SLPa across the tropical Pacific Ocean and the canonical horseshoeshaped SSTa pattern in the tropics. This footprinting mechanism provides a link from the extratropics to Schneider and Di Lorenzo, in prep. the tropics. However it is FIG. 4. (left) Lag correlations between SLPa (hPa; from NCEP/NCAR reanalysis) and SLPa unclear if the tropics have at Hawaii (hPa; from NCEP/NCAR reanalysis). Top row: For the boreal summer in year -1. a feedback on the Middle row: For the boreal spring in year 0. Bottom row: For the boreal winter in year +1. extratropics by affecting (right) Same as left except for SSTa (°C; from Smith and Reynolds (2004)). the NPO. To explore preliminary evidence of the tropics affecting the NPO, we look at the negative lags (Fig. 4, top row). During the boreal summer in year -1, the SLPa correlation map shows positive correlations (r > 0.3) in the western tropical Pacific Ocean. Furthermore, the SSTa correlation pattern shows a distinct warming across most of the tropical oceans but in particular stronger correlations with warmer SSTa in the eastern tropical Pacific Ocean with high SLPa in Hawaii (Fig. 4, top row). Hence, there are indications that the NPO may not be purely a stochastic mode but may have a deterministic component forced by the tropics. Furthermore, because the NPO and NPGO are directly involved with decadal modulations of the KOE, there appears to be a link between the tropical Pacific Ocean and the KOE. This link/hypothesis has not been explored in previous climate literature. Hypotheses & Research Plan. Figure 5 graphically presents a synthesis of our previous results and the avenues of research we would like to pursue. We use this figure to motivate our central research question: Can we isolate new mechanisms underlying decadal extratropical-tropical interactions in the North Pacific? To address this question, we formulate five hypotheses that we intend to test. H1: The NPGO is forced by the NPO and is related to changes in the KOE. This hypothesis covers the right side of the loop in Fig. 5 and will serve to corroborate further the preliminary evidence presented in this proposal using additional observational datasets and model simulations. H2: The NPGO is part of the footprinting mechanism that links North Pacific extratropical forcing to the tropics This hypothesis is supported by both Figs. 2 and Fig. 4. Together with hypothesis H1, we will construct a coherent picture of how the extratropical North Pacific influences tropical Pacific climate variability. H3: The NPO is not purely stochastic FIG. 5. Diagram synthesizing the concepts presented in this proposal and how our but has a deterministic component forced in research will be organized. The diagram is constructed as a loop linking the extratropics to the tropics via NPO-NPGO interactions and the seasonal footprinting mechanism the western tropical Pacific Ocean. In from Vimont et al. (2003). The tropics then feed back into the extratropics via the concert with the previous western tropical Pacific Ocean and precursors there in the SLPa field. Two additional hypothesis, we want to explain what avenues of research are also depicted in the diagram. One is the link between the portion of the NPGO forcing NPGO and the KOE. The second is the assumption of stochastic forcing for the NPO. together, this diagram suggests a quasi-decadal loop of variability for the Pacific originates from extratropical Taken Ocean basin. atmospheric “noise” and what portion is deterministic from other influences. One area of interest to investigate the western tropical Pacific Ocean, where SLP changes precede the canonical NPO signature the following year (Fig. 4). The NPO might also be linked to extratropical forcing via large-scale planetary waves. This idea may be more difficult to explore but will be pursued if evidence surfaces. H4: ENSO dynamics forces the NPO precursor in the western tropical Pacific. The ENSO-like pattern that originates through the SSTa footprinting mechanism (Fig. 4, bottom row) and that precedes the NPO-signature (Fig. 4, top row) makes this hypothesis noteworthy. The interannual variability associated with ENSO could also work as a modulation for the NPO. These first four hypotheses effectively complete the “loop” presented in Fig. 5, and together suggest that the links between the extratropics and the tropics could constitute a quasi-decadal loop of climate variability. In addition to better understanding these tropical-extratropical interactions in PDV, evidence of increases in NPGO activity in future climate scenarios (Di Lorenzo et al. 2008) motivates one final hypothesis for this work. H5: Components of the quasi-decadal loop of variability depicted in Fig. 5 will amplify in magnitude and variability in an increasingly warmer climate. While examining the changes in PDV in these climate models, we can also assess the degree to which each model contains the mechanisms and links hypothesized in Fig. 5. Observational and Modeling Datasets. To examine our hypotheses, we plan on using a suite of observational datasets, including: • NCAR/NCEP and ERA-40 reanalysis products for atmospheric variables (SLP, winds, geopotential heights, and temperatures used to further investigate the influence of the NPO on the NPGO and potential links to the tropics; • Smith and Reynolds (2004) SST dataset; • Satellite data (e.g., AVISO) for SSTs and SSHs to complement the atmospheric variables and also examine changes in the KOE. Along with the observational datasets, we will also assess the degree to which hypotheses H1 - H4 (i.e., the various components of Fig. 5) are true in a collection of model output. We currently have access to the GFDL 2.0 model output, both coupled and AMIP simulations, for the pre-industrial (1861-2000) and 21st century runs used in the IPCC report. We also plan on examining how the output from the NASA GISS coupled ocean-atmosphere model (e.g., Schmidt et al. 2006) and the ocean GCM for the Earth Simulator (OFES; Masumoto et al. 2004) agrees with our observational results. North Pacific ocean high-resolution model hindcasts with the Regional Ocean Modeling System (ROMS, Haidvogel et al., 2008) will also be used and compared to the other modeling/observational datasets. We also plan to perform sensitivity analyses to different SSTa boundary conditions with a AGCM developed at International Center for Theoretical Physics (ICTP) by Molteni (2003). Collaborations. This research project will be done in close collaboration with Dr. Niklas Schneider in the Department of Oceanoggraphy at the University of Hawaii at Manoa. I plan to spend two month at the University of Hawaii to work with Dr. Schneider and interact with other scientists at the International Pacific Research Center (IPRC), who are leading experts in KOE decadal variability (e.g. Qiu) and ENSO dynamics (e.g. Timmerman). Also, the collaborative efforts will provide access to runs from OFES. References Alexander, M.A., I. Bladé, M. Newman, J.R. Lanzante, N.-C. Lau, and J.D. Scott, 2002: The atmospheric bridge: The influence of ENSO teleconnections on air-sea interaction over the global ocean. J. Climate, 15, 2205 – 2231. Barnett, T.P., D.W. Pierce, M. Latif, D. Dommenget, and R. Saravanan, 1999a: Interdecadal interactions between the tropics and midlatitudes in the Pacific basin. Geophys. Res. Lett., 26, 615 – 618. -------, -------, R. Saravanan, N. Schneider, D. Dommenget, and M. Latif, 1999: Origins of the midlatitude Pacific decadal variability. Geophys. Res. Lett., 26, 1453 – 1456. Deser, C., M.A. Alexander, and M.S. Timlin, 2003: Understanding the persistence of sea surface temperature anomalies in midlatitudes. J. Climate, 16, 57 – 72. -------, A.S. Phillips, and J.W. Hurrell, 2004: Pacific interdecadal climate variability: Linkages between the tropics and the North Pacific during boreal winter since 1900. J. Climate, 17, 3109 – 3124. Di Lorenzo, E., N. Schneider, K.M. Cobb, K. Chhak, P.J.S. Franks, A.J. Miller, J.C. McWilliams, S.J. Bograd, H. Arango, E. Curchitser. T.M. Powell, and P. Rivière, 2008: North Pacific Gyre Oscillation links ocean climate and ecosystem change. Geophys. Res. Lett., in press. Haidvogel D., H. Arango, W.P. Budgell, B.D. Cornuelle, E. Curchitser, E. Di Lorenzo, K. Fennel, W.R. Geyer, A.J. Hermann, L. Lanerolle, J. Levin, J.C. McWilliams, A.J. Miller, A.M. Moore, T.M. Powell, A.F. Shchepetkin, C.R. Sherwood, R.P. Signell, J.C. Warner, J. Wilkin, 2008: Ocean forecasting in terrain-following coordinates: Formulation and skill assessment of the Regional Ocean Modeling System. Journal of Computational Physics, in press. Latif, M., and T.P. Barnett, 1996: Decadal climate variability over the North Pacific and North America: Dynamics and predictability. J. Climate, 9, 2407 – 2423. Mantua, N.J., S.R. Hare, Y. Zhang, J.M Wallace, and R.C. Francis, 1997: A Pacific interdecadal climate oscillation with impacts on salmon production. Bull. Amer. Meteor. Soc., 78, 1069 – 1079. Masumoto, Y., and Coauthors. A fifty-year eddy-resolving simulation of the World ocean-Preliminary outcomes of the OFES (OGCM for the Earth Simulator). J. Earth Simul., 1, 31 – 52. Molteni, F., 2003: Atmospheric simulations using a GCM with simplified physical parameterization. I: Model climatology and variability in multi-decadal experiments. Climate Dyn., 20, 175-191. Namias, J., 1969: Seasonal interactions between the North Pacific Ocean and the atmosphere during the 1960s. Mon. Wea. Rev., 97, 173 – 192. Pierce, D.W., 2002: The role of sea surface temperatures in interactions between ENSO and the North Pacific Oscillation. J. Climate, 15, 1295 – 1308. -------, T.P. Barnett, and M. Latif, 2000: Connections between the Pacific Ocean tropics and midlatitudes on decadal timescales. J. Climate, 13, 1173 – 1193. Qiu, B., 2000: Interannual variability of the Kuroshio Extension system and its impacts on the wintertime SST field. J. Phys. Oceanogr., 30, 1486 – 1502. -------, 2002: The Kuroshio Extension system: Its large-scale variability and role in the midlatitude oceanatmosphere interaction. J. Oceanogr., 58, 57 – 75. Rogers, J.C., 1981: The North Pacific Oscillation. J. Climatol., 1, 39 – 57. ------- 1990: Patterns of low-frequency monthly sea level pressure variability (1899-1986) and associated wave cyclone frequencies. J. Climate, 3, 1364 – 1379. Schmidt, G.A., and Coauthors: Present day atmospheric simulations using GISS ModelE: Comparison to in situ, satellite and reanalysis data. J. Climate 19, 153-192. Schneider, N., and B.D. Cornuelle, 2005: The forcing of the Pacific Decadal Oscillation. J. Climate, 18, 4355 – 4373. Smith, T.M., and R.W. Reynolds, 2004: Improved extended reconstruction of SST (1864 - 1997). J. Climate, 17, 2466 - 2477. Taguchi, B., S.-P. Xie, N. Schneider, M. Nonaka, H. Sasaki, and Y. Sasai, 2007: Decadal variability of the Kuroshio Extension: Observations and an eddy-resolving model hindcast. J. Climate, 20, 2357 – 2377. Trenberth, K.E., and T.P. Barnett, 1994: Decadal atmosphere-ocean variations in the Pacific. Climate Dyn., 9, 303 – 319. Vimont, D.J., D.S. Battisti, and A.C. Hirst, 2001: Footprinting: A seasonal connection between the tropics and mid-latitudes. Geophys. Res. Lett. 28, 3923 – 3926. -------, -------, and -------, 2003: The seasonal footprinting mechanism in the CSIRO general circulation models. J. Climate, 16, 2653 – 2667. Walker, G. T., and E. W. Bliss, 1932: World weather V. Mem. Roy. Meteor. Soc., 4, 53-84.
