bioclimatic parameters were extract
advertisement
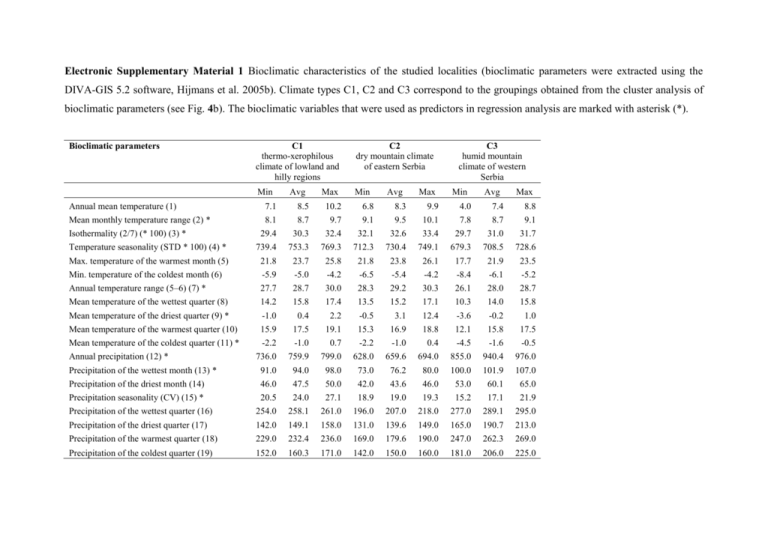
Electronic Supplementary Material 1 Bioclimatic characteristics of the studied localities (bioclimatic parameters were extracted using the DIVA-GIS 5.2 software, Hijmans et al. 2005b). Climate types C1, C2 and C3 correspond to the groupings obtained from the cluster analysis of bioclimatic parameters (see Fig. 4b). The bioclimatic variables that were used as predictors in regression analysis are marked with asterisk (*). Bioclimatic parameters Annual mean temperature (1) Mean monthly temperature range (2) * C1 thermo-xerophilous climate of lowland and hilly regions C2 dry mountain climate of eastern Serbia Min Min 7.1 Avg 8.5 Max 10.2 6.8 Avg Max 8.3 9.9 C3 humid mountain climate of western Serbia Min 4.0 Avg 7.4 Max 8.8 8.1 8.7 9.7 9.1 9.5 10.1 7.8 8.7 9.1 29.4 30.3 32.4 32.1 32.6 33.4 29.7 31.0 31.7 Temperature seasonality (STD * 100) (4) * 739.4 753.3 769.3 712.3 730.4 749.1 679.3 708.5 728.6 Max. temperature of the warmest month (5) 21.8 23.7 25.8 21.8 23.8 26.1 17.7 21.9 23.5 Isothermality (2/7) (* 100) (3) * Min. temperature of the coldest month (6) -5.9 -5.0 -4.2 -6.5 -5.4 -4.2 -8.4 -6.1 -5.2 Annual temperature range (5–6) (7) * 27.7 28.7 30.0 28.3 29.2 30.3 26.1 28.0 28.7 Mean temperature of the wettest quarter (8) 14.2 15.8 17.4 13.5 15.2 17.1 10.3 14.0 15.8 Mean temperature of the driest quarter (9) * -1.0 0.4 2.2 -0.5 3.1 12.4 -3.6 -0.2 1.0 Mean temperature of the warmest quarter (10) 15.9 17.5 19.1 15.3 16.9 18.8 12.1 15.8 17.5 Mean temperature of the coldest quarter (11) * -2.2 -1.0 0.7 -2.2 -1.0 0.4 -4.5 -1.6 -0.5 736.0 759.9 799.0 628.0 659.6 694.0 855.0 940.4 976.0 Precipitation of the wettest month (13) * 91.0 94.0 98.0 73.0 76.2 80.0 100.0 101.9 107.0 Precipitation of the driest month (14) 46.0 47.5 50.0 42.0 43.6 46.0 53.0 60.1 65.0 Precipitation seasonality (CV) (15) * 20.5 24.0 27.1 18.9 19.0 19.3 15.2 17.1 21.9 Precipitation of the wettest quarter (16) 254.0 258.1 261.0 196.0 207.0 218.0 277.0 289.1 295.0 Precipitation of the driest quarter (17) 142.0 149.1 158.0 131.0 139.6 149.0 165.0 190.7 213.0 Precipitation of the warmest quarter (18) 229.0 232.4 236.0 169.0 179.6 190.0 247.0 262.3 269.0 Precipitation of the coldest quarter (19) 152.0 160.3 171.0 142.0 150.0 160.0 181.0 206.0 225.0 Annual precipitation (12) *
