Media:SEEDTutorial - Genomics and Bioinformatics
advertisement

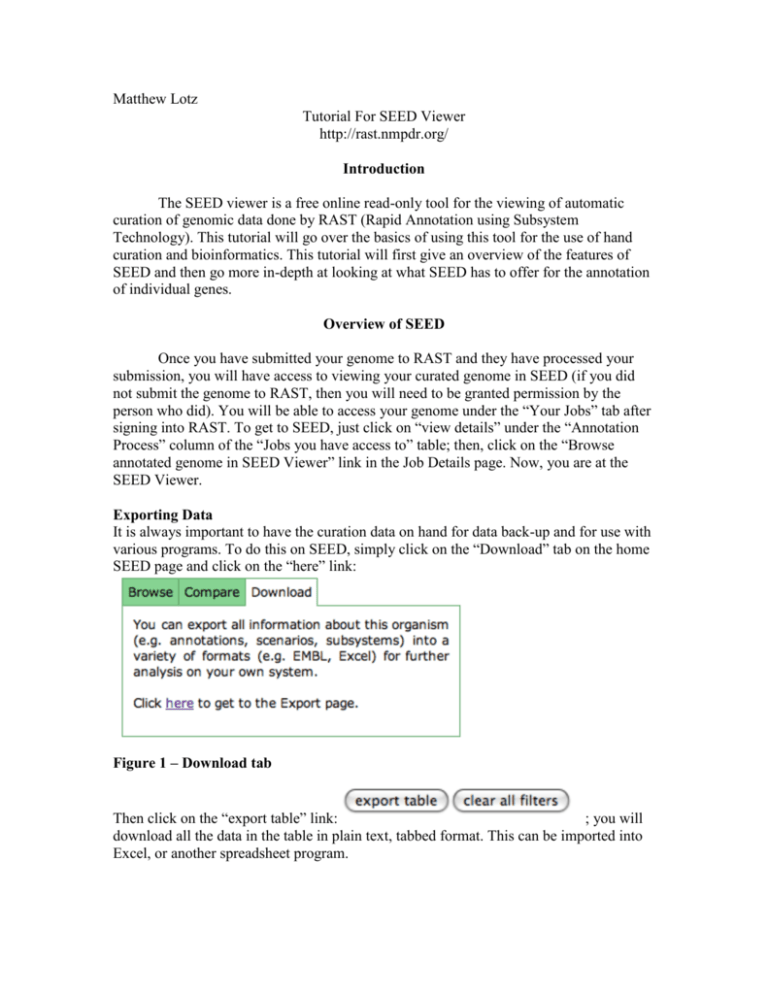
Matthew Lotz Tutorial For SEED Viewer http://rast.nmpdr.org/ Introduction The SEED viewer is a free online read-only tool for the viewing of automatic curation of genomic data done by RAST (Rapid Annotation using Subsystem Technology). This tutorial will go over the basics of using this tool for the use of hand curation and bioinformatics. This tutorial will first give an overview of the features of SEED and then go more in-depth at looking at what SEED has to offer for the annotation of individual genes. Overview of SEED Once you have submitted your genome to RAST and they have processed your submission, you will have access to viewing your curated genome in SEED (if you did not submit the genome to RAST, then you will need to be granted permission by the person who did). You will be able to access your genome under the “Your Jobs” tab after signing into RAST. To get to SEED, just click on “view details” under the “Annotation Process” column of the “Jobs you have access to” table; then, click on the “Browse annotated genome in SEED Viewer” link in the Job Details page. Now, you are at the SEED Viewer. Exporting Data It is always important to have the curation data on hand for data back-up and for use with various programs. To do this on SEED, simply click on the “Download” tab on the home SEED page and click on the “here” link: Figure 1 – Download tab Then click on the “export table” link: ; you will download all the data in the table in plain text, tabbed format. This can be imported into Excel, or another spreadsheet program. Comparing Genes of Two RAST-annotated Organisms RAST makes it easy to compare the presence of genes between two different RASTannotated species. To do this, click on the “Compare” tab on the SEED home page (right next to the “Download” tab – see Figure 1 above). Then, select a species to compare your species to. For instance, figure 2 contains an excerpt of the comparison of the Halorhabdus utahensis genome to another halophile, Halobacterium sp. NRC1: Figure 2 – Comparison chart of Halorhabdus utahensis to Halobacterium sp. NRC-1 This chart denotes the two organisms as “A” (your species of interest) and “B” (the species you selected for comparison). Genes of each species are then listed according to category/subcategory which allows for easy comparison of certain subsections/metabolic pathways of the species. You can toggle these categories and subcategories within the table. This tool allows you to select genes that are common to both species by selecting “A and B” under the “Presence” column; you can also look for differences by selecting “A” or “B.” You can then look in-depth at genes of interest by clicking on the link to the gene (in the “Organism A” or “Organism B” columns). Subsystem Information On the SEED home page, the genome is split into categories and displayed in a pie chart. This feature allows you to view genes that have been automatically assigned to certain functions of the organism. The pie chart is labeled with the different subsystems of a typical organism, you can maximize the categories (click the +) to explore specific subsections. You can also view the same information in an exportable table format by clicking on the “Features in Subsystems” tab. You can export the table by clicking on “export to file” ( ). Links On the Navigation Tool Bar Figure 3 – Navigation Tool Bar 1) “Navigate” - “Startpage” – Allows you to link to: the SEED viewer for and RAST-annotated genome, any subsystem, search for the ID of a gene, search for text, or BLAST search - “Organisms” – Links to SEED viewer for all RAST-annotated genomes - “Subsystems” – Links to subsystem tool as explained below in “Subsystems” - “FigFams” – “FIGfams are sets of protein sequences that are similar along the length of the proteins. Proteins are thought of as implementing one or more abstract functional roles, and all of the members of a single FIGfam are believed to implement precisely the same set of functional roles.” This link allows you to search for a certain FIGfam or enter in a FASTA sequence to see if it matches a FIGfam. - “BLAST search” – Link to a page that allows you to enter in the nucleotide or amino acid sequence of a gene/protein to conduct a BLASTn or BLASTp search. 2) “Organism” - “General Information” – takes you to the SEED homepage of the organism - “Feature Table” – takes you to the Genome Browser (this and “Genome Browser” are the same link) - “Genome Browser” – a table of all genes in the genome, this tutorial goes into more detail on this subsection later - “Scenarios” – Another way to access the “subsystems;” this search allows you to look for the use of certain compounds as reactants or products in a metabolic pathway/subsystem. See “Subsystems” below for more information. - “Subsystems” – Allows you to explore if certain subsystems are present in a given organism, and allows you compare the genes that are present in that organism compared to other, similar organisms. For example, here is an excerpt of the table that looks at Respiratory dehydrogenases in Halorhabdus utahensis as compared to other organisms: Figure 4 - Subsystem Comparison Chart (exerpt) The Chart shows genes that code for certain proteins within the subsystem (e.g. 1310 coding for ND2). Based on genes present, RAST assigns the organism a value under “Variant.” Values -1 and 0 always mean subsystem is not present, and subsystem presence unknown, respectively. The meaning of other numbers are relative to the subsystem being searched. For instance, in the Respiratory dehydrogenases subsystem table shown, 1 means “at least one dehydrogenase function from ones being listed is present in an organism.” To see what the numbers denote, click on the additional notes tab: This tab also contains valuable information on what the role of the subsystem is within the organism. - “Export” – Link to export data as explained in “Exporting Data” above 3) “Comparative Tools” – This tab contains links to all of the same comparison tools under the “Compare” tab explained above in “Comparing Genes of Two RAST-annotated Organisms” (i.e. “function-based comparison,” “sequence-based comparison, KEGG and BLAST). Using SEED to Explore/Annotate a Gene Now, let’s look a some tools that SEED has that can help us explore specific genes. Genome Browser To look at a specific gene, it is best to go to the “Genome Browser” (under the “Organism” tab). You can search for a specific gene by expanding the total number of genes displayed on the table to the total number and using the command+f (or control + f for PC users) to find a specific start or stop location, function, or feature ID of the gene. I will use fig|146826.3.peg.1 (Dihydroxy-acid dehydratase) as an example. Once you have found a gene of interest, you can click on to have the genome brower highlight the coding region in which the gene is contained. For example: Figure 5 - Showing general location of a gene Figure five shows that after you hit “show” the coding region that the gene is contained by highlighting it in red. The Genome Browser table also contains other information. Genes can be sorted by type: either RNA or CDS (Coding sequence). It also contains the length of the gene in base pairs, a summary of the protein that the gene codes for, and the subsystem that the gene belongs to (if any). Annotation Overview When you click on a specific gene, you are taken to the “Annotation Overview” of that gene. Let’s look at some of the information contained on this page. - Feature ID – contains the unique ID of the gene as well as links to the Genome Browser (“browse” link), Visual and Tabular Protein Evidence (i.e. alignments of similar proteins of different species) (“evidence” link) and the sequence page (you can select DNA, DNA with flanking or Protein Sequence there) (“sequence” link) - Run Tool – allows a quick running of an external program to look at alignments, similar genes, etc. Tools included in this subsection include Psi-Blast (a good tool to find distant relatives of a protein). - Current Assignment – Displays the predicted protein coded for by the gene. The “history” button contains information on annotation history, including basic reason for why the gene was assigned to code for a particular protein. - Organism – Links back to Genome Browser - Clearinghouse – Searches for a list of very close matches of the gene contained within other RAST genomes - EC Number – This is an important piece of information. The EC Number is a unique code assigned to each enzyme. This link takes you to KEGG, which is a powerful search engine for metabolic pathways. - Taxonomy ID – The NCBI taxonomy ID for the organism. The link takes you to the NCBI profile for the organism. This page contains some useful information, such as outside sources and references. (see screenshots below) These two tables of links can be found on this NCBI taxonomy page. They contain links to scholarly research/articles that used or are about the organism of interest. Compare Regions The Annotation Overview also contains information about the genes that surround the gene of interest and similar regions of DNA in similar organisms in the “Visual Region Information” graphic and the “Tabular Region Information” table. You can use this information to form a hypothesis on whether or not the gene is part of an operon. An operon is one or more genes that operate as a single unit with an operator and promoter; an operon is usually predicted by having a gene adjacent to it upstream. For instance, our example is likely part of an operon: Figure 6 - Visual Region Information - Gene of interest in red Sequences To obtain nucleotide or amino acid sequences, go to the “Feature” tab at the top of the Annotation Overview page, and select the type of sequence you want; or, click on the “sequence” link next to Feature ID as mentioned before. These sequences allow you to use other online tools such as the various forms of NCBI BLAST, which match your gene to similar genes to give you more evidence for the your predicted function of the gene. Feature Tools The “Feature Tools” tab on the top of the Annotation Overview page links you to various external searches that can be useful in annotation. For instance, PSORT (in this example, I used the gram-negative version) helps you to predict where the predicted coded protein localizes within the organism/cell of the organism. Here are all the tools available:


