Cemetery Study - Honors Environmental Science Home Page
advertisement
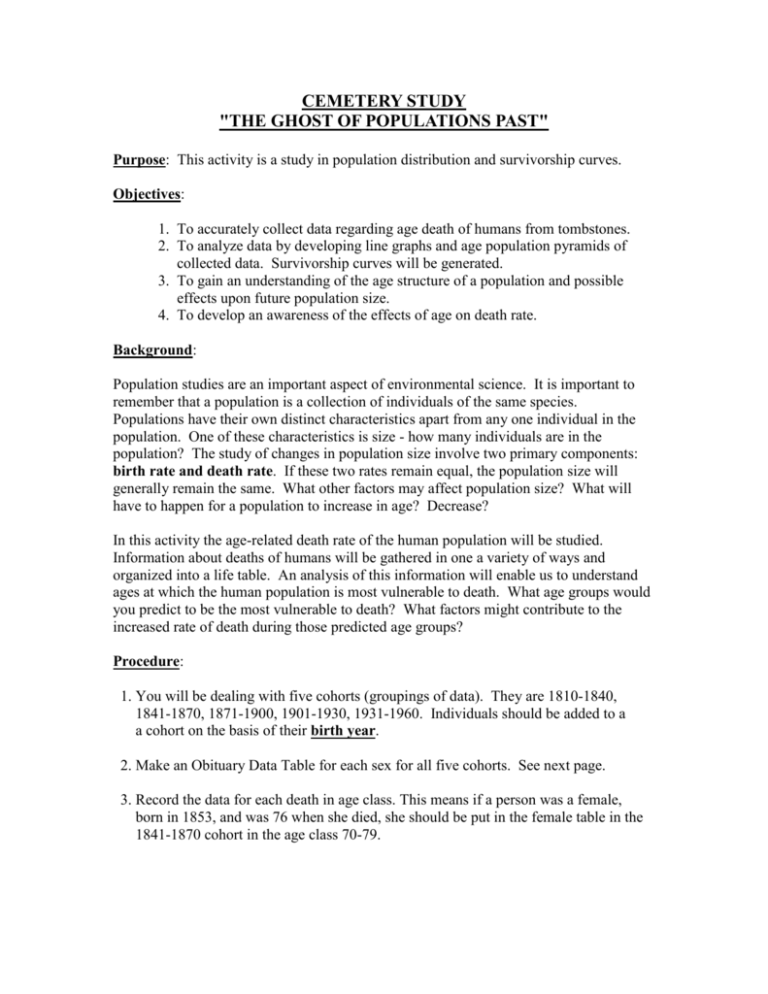
CEMETERY STUDY "THE GHOST OF POPULATIONS PAST" Purpose: This activity is a study in population distribution and survivorship curves. Objectives: 1. To accurately collect data regarding age death of humans from tombstones. 2. To analyze data by developing line graphs and age population pyramids of collected data. Survivorship curves will be generated. 3. To gain an understanding of the age structure of a population and possible effects upon future population size. 4. To develop an awareness of the effects of age on death rate. Background: Population studies are an important aspect of environmental science. It is important to remember that a population is a collection of individuals of the same species. Populations have their own distinct characteristics apart from any one individual in the population. One of these characteristics is size - how many individuals are in the population? The study of changes in population size involve two primary components: birth rate and death rate. If these two rates remain equal, the population size will generally remain the same. What other factors may affect population size? What will have to happen for a population to increase in age? Decrease? In this activity the age-related death rate of the human population will be studied. Information about deaths of humans will be gathered in one a variety of ways and organized into a life table. An analysis of this information will enable us to understand ages at which the human population is most vulnerable to death. What age groups would you predict to be the most vulnerable to death? What factors might contribute to the increased rate of death during those predicted age groups? Procedure: 1. You will be dealing with five cohorts (groupings of data). They are 1810-1840, 1841-1870, 1871-1900, 1901-1930, 1931-1960. Individuals should be added to a a cohort on the basis of their birth year. 2. Make an Obituary Data Table for each sex for all five cohorts. See next page. 3. Record the data for each death in age class. This means if a person was a female, born in 1853, and was 76 when she died, she should be put in the female table in the 1841-1870 cohort in the age class 70-79. 4. Construct five Cemetery Life Tables, one for each cohort. For both males and females, determine the number of individuals who die (D) for each age group from your Obituary Data Tables. Enter the total # of individuals (I) in the study at I for 0-9 years of age. Subtract D0-9 from I0-9 to determine I for 10-19 years and so on. (For example, if there were 250 individuals in your study and 7 of them died between the ages of 0-9, 243 individuals would be left in the study for age 10-19) 5. Determine the Mortality Rate (M) by dividing the number of deaths (D) by the number of individuals (I) in each age group: M = D/I 6. Construct a line graph for each cohort of age group (X) vs. individuals left in study (I). This represents your survivorship curves. Plot male and female survivorship curves on the same graph. 7. Plot a population histogram for each cohort of Mortality Rate (M) vs. Age Group (X). 8. Count everything up. You should have 5 double line graphs, 5 histograms, 5 cemetery life data tables and 2 obituary data tables, one for each sex. Questions: 1. What is your interpretation of juvenile mortality (0-9) pre- and post-1930 for males? females? List all the factors that might account for any differences you see. 2. What is your interpretation of mortality for all reproductive age adults ages 20-40 for pre- and post-1930 males and females? List all the factors that might account for any differences you see. 3. What is your interpretation of mortality for adults ages 60-80 for pre- and post-1930 for males and females? List all the factors that might account for any differences you see. 4. What shifts in the survivorship and mortality curves would you expect if environmental problems worsen and pollution-related diseases increase? 5. What shifts in the survivorship and mortality curves would you expect if cutbacks to social services such as prenatal and infant care are enacted? 6. Why might data that you have collected be useful to an insurance company? OBITUARY DATA TABLE - One for males and females! _____ 18101840 18101840 18411870 18411870 18711900 18711900 19001930 19001930 19301960 19301960 _____ age class of males deaths in age class age class of males deaths in age class age class of males deaths in age class age class of males deaths in age class age class of males deaths in age class 0-9 10-19 20-29 30-39 40-49 50-59 60-69 70-79 80-89 90-99 100 + CEMETERY LIFE DATA TABLE -One for each cohort! age interval (x) 0-9 10-19 20-29 30-39 40-49 50-59 60-69 70-79 80-89 90-99 100 + # left in study male (I) # left in study female (I) # die in interval male (D) # left in interval female (D) mortality rate male (M) mortality rate female (M)
