Area distortion increases as absolute latitude increases
advertisement
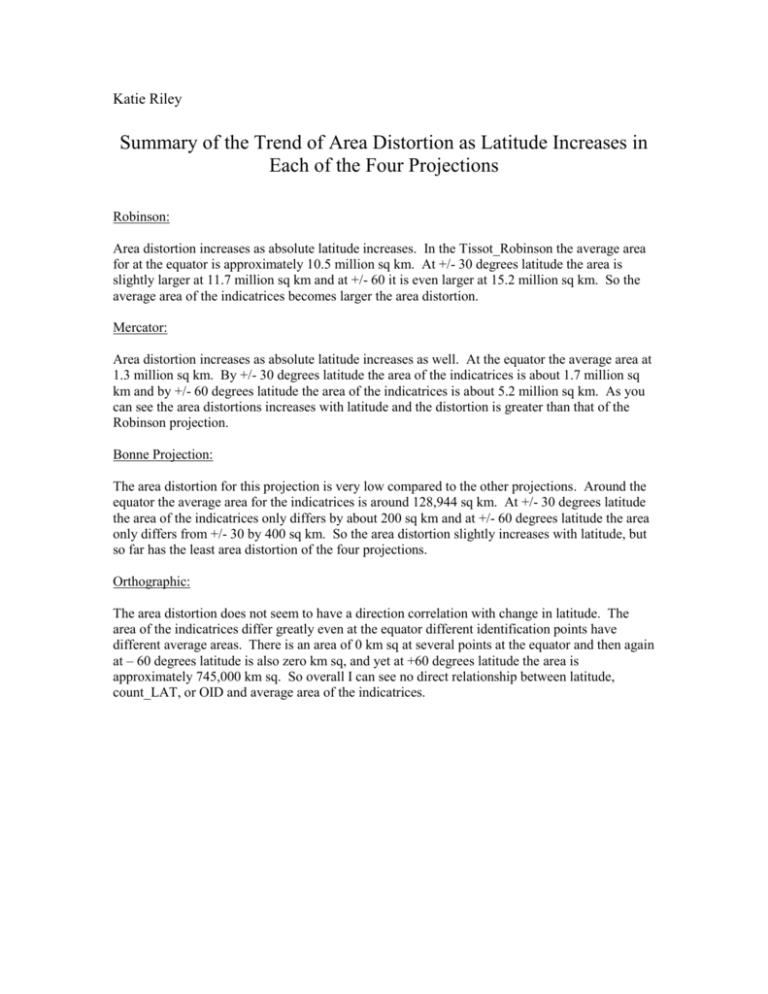
Katie Riley Summary of the Trend of Area Distortion as Latitude Increases in Each of the Four Projections Robinson: Area distortion increases as absolute latitude increases. In the Tissot_Robinson the average area for at the equator is approximately 10.5 million sq km. At +/- 30 degrees latitude the area is slightly larger at 11.7 million sq km and at +/- 60 it is even larger at 15.2 million sq km. So the average area of the indicatrices becomes larger the area distortion. Mercator: Area distortion increases as absolute latitude increases as well. At the equator the average area at 1.3 million sq km. By +/- 30 degrees latitude the area of the indicatrices is about 1.7 million sq km and by +/- 60 degrees latitude the area of the indicatrices is about 5.2 million sq km. As you can see the area distortions increases with latitude and the distortion is greater than that of the Robinson projection. Bonne Projection: The area distortion for this projection is very low compared to the other projections. Around the equator the average area for the indicatrices is around 128,944 sq km. At +/- 30 degrees latitude the area of the indicatrices only differs by about 200 sq km and at +/- 60 degrees latitude the area only differs from +/- 30 by 400 sq km. So the area distortion slightly increases with latitude, but so far has the least area distortion of the four projections. Orthographic: The area distortion does not seem to have a direction correlation with change in latitude. The area of the indicatrices differ greatly even at the equator different identification points have different average areas. There is an area of 0 km sq at several points at the equator and then again at – 60 degrees latitude is also zero km sq, and yet at +60 degrees latitude the area is approximately 745,000 km sq. So overall I can see no direct relationship between latitude, count_LAT, or OID and average area of the indicatrices.

