Supplementary Informations (doc 86K)
advertisement
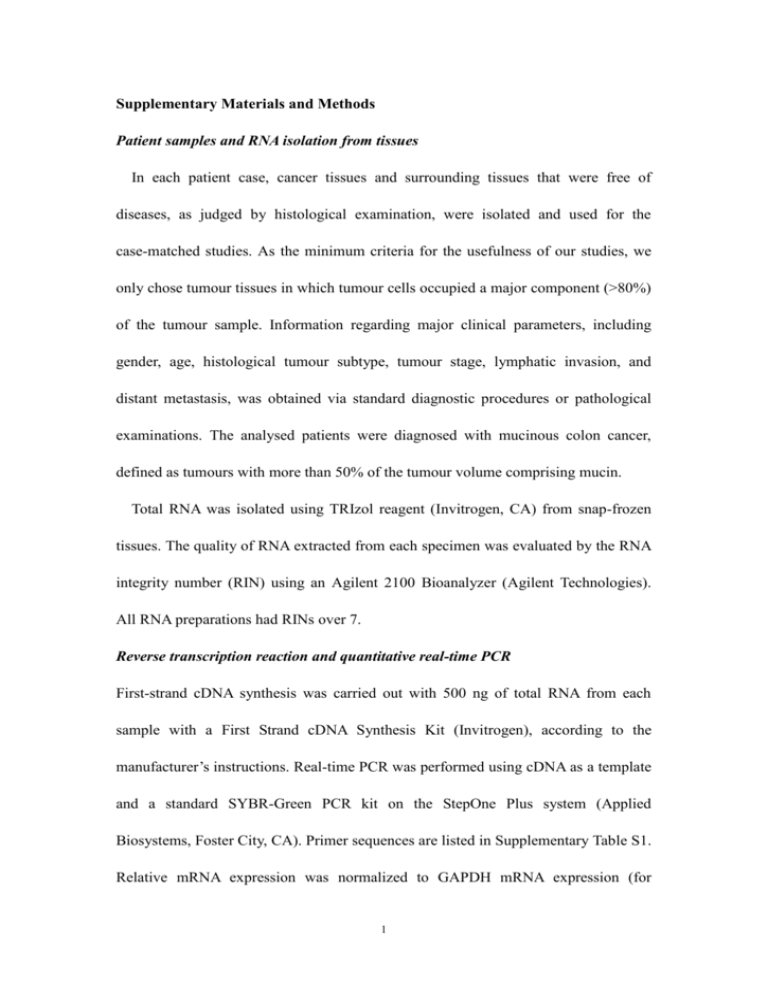
Supplementary Materials and Methods Patient samples and RNA isolation from tissues In each patient case, cancer tissues and surrounding tissues that were free of diseases, as judged by histological examination, were isolated and used for the case-matched studies. As the minimum criteria for the usefulness of our studies, we only chose tumour tissues in which tumour cells occupied a major component (>80%) of the tumour sample. Information regarding major clinical parameters, including gender, age, histological tumour subtype, tumour stage, lymphatic invasion, and distant metastasis, was obtained via standard diagnostic procedures or pathological examinations. The analysed patients were diagnosed with mucinous colon cancer, defined as tumours with more than 50% of the tumour volume comprising mucin. Total RNA was isolated using TRIzol reagent (Invitrogen, CA) from snap-frozen tissues. The quality of RNA extracted from each specimen was evaluated by the RNA integrity number (RIN) using an Agilent 2100 Bioanalyzer (Agilent Technologies). All RNA preparations had RINs over 7. Reverse transcription reaction and quantitative real-time PCR First-strand cDNA synthesis was carried out with 500 ng of total RNA from each sample with a First Strand cDNA Synthesis Kit (Invitrogen), according to the manufacturer’s instructions. Real-time PCR was performed using cDNA as a template and a standard SYBR-Green PCR kit on the StepOne Plus system (Applied Biosystems, Foster City, CA). Primer sequences are listed in Supplementary Table S1. Relative mRNA expression was normalized to GAPDH mRNA expression (for 1 real-time RT-PCR) or to the total input (for ChIP experiments) and calculated according to the 2-ΔΔCT method, as appropriate (1) . Bisulfite sequence analysis Genomic DNA from tissues and cells were extracted using the Axygen genomic DNA purification kit (Axygen Biotechnology, Hangzhou, China). Genomic DNA (500 ng) was bisulfite-converted using the EZ DNA Methylation-Gold kit (Zymo Research, Orange, CA), following the manufacturer’s protocol. Modified genomic DNA was then amplified by PCR with primers specific to the respective genomic region. The PCR amplicons were gel-purified and cloned into pMD-18T vectors (TaKaRa). At least 6 clones were randomly selected and individually sequenced on an ABI3730xl DNA Analyzer to ascertain the methylation patterns of each locus. PCR clones with less than 98% C to T conversion efficiency outside CpG sites were excluded from further analysis. The percentage of methylation was calculated as the number of methylated cytosines divided by the total number of cytosines in all of the amplicons analysed. Quantitative real-time methylation-specific PCR Genomic DNA from both tumoral and normal tissues was treated with sodium bisulfite to modify unmethylated cytosines to uracil (2) . After the DNA conversion, an aliquot of 2 l was amplified by quantitative real-time PCR using a primer set specific to the methylated/unmethylated sequence (3) . Appropriate MSP primers were designed using MethPrimer (University of California, San Francisco). Primer sequences are listed in Supplementary Table S1. Serial dilutions of methylated or 2 unmethylated control genomic DNAs (Zymo Research, CA, USA) were used to construct standard curves. To correct for differences in both quality and quantity between samples, GAPDH was used as an internal control. The bisulfite reaction and MSP for all samples were repeated at least one time to confirm the methylation status. Representative PCR products were separated in a 2% agarose gel, stained with ethidium bromide and visualized under UV illumination. The MI in each sample was calculated using the following equation: MI=M/(M+U)100. MI≥0.5 was considered as highly methylatedGAD1. MI<0.5 was considered as lowly methylated GAD1. Chromatin conformation capture (3C) We employed the 3C procedure (4) with minor modifications. Briefly, HUVEC, THLE-3 and SW480 cell extracts were prepared from 107 cells by crosslinking with 1% formaldehyde for 10 minutes at 4°C, followed by quenching with 0.125 M glycine. Cell lysates were prepared in 10 mM Tris (pH 8.0), 10 mM NaCl and 0.2% NP40, including proteinase inhibitors. Nuclei were re-suspended in NEB buffer 3 and were lysed by adding SDS to a final concentration of 0.3% and incubating at 37°C for 1 hour. Triton X-100 was added to a final concentration of 1.8%, followed by incubation at 37°C for 1 hour. Subsequently, crosslinked nuclear extracts were digested with 800 U of EcoRI (New England Biolabs) for 16 hours, followed by restriction enzyme inactivation using SDS at a final concentration of 1.5% and incubation at 65°C for 20 minutes. Fifteen percent of the crosslinked and digested extracts was diluted in a total volume of 4 ml and ligated at 16°C for 16 hours using 3 40,000 U of T4 ligase (New England Biolabs) and the appropriate buffer. Religated products were digested with proteinase K at 65°C for 16 hours, followed by phenol/chloroform extraction and ethanol precipitation. Religation was tested by PCR using the primers indicated in Supplementary Table S1. Bioinformatics and database analysis To analysis the methylation status of GAD1, we used our previous data on DNA methylomes from three sets of normal colon, non-CIMP and CIMP colon cancer samples. These data were obtained from the NCBI Sequence Read Archive (SRA) (http://trace.ncbi.nlm.nih.gov/Traces/sra/sra.cgi) under the accession number SRA029584. RefSeq gene promoters were defined as the regions 1000 bp upstream and 500 bp downstream of an annotated RefSeq transcription start site. CpG islands were defined by the CpG island annotation from the reference human genome (NCBI build 36.1, UCSC Hg18). CTCF binding sites were compiled from all available CTCF ChIP-Seq data sets deposited by the Broad Institute on the UCSC Genome Browser (5) . The methylation status was obtained from the ENCODE Hudson Alpha Methyl-seq database. The CTCF consensus binding sites (score) were analysed using the in silico CTCFBS prediction tool (http://insulatordb.uthsc.edu/help.php#tool) (6) . 4 Supplementary Figure Legends Fig. S1. Summary of GAD1 expression in cancer vs. normal tissues. These data were obtained from Oncomine, a cancer microarray database and integrated data-mining platform (www.oncomine.com) (7) . (A) The data in the greenbox indicated the mRNA expression profile between cancer and normal tissues in different cancer types. We used stringent selecting thresholds: 1) GAD1 is among the top 10% differentially expressed genes between cancer and normal tissues; 2) the fold change of cancer/normal tissue expression is >1.5; 3) the P value is <0.0001. Red indicates that GAD1 expression is increased in cancer. Blue indicates that GAD1 expression is decreased in cancer. These data indicated that GAD1 is over-expressed in most cancers, except in some brain and kidney cancers. (B) Representative data for GAD1 over-expression in colon adenoma tissues. The expression profile is obtained from the Oncomine database. Raw microarray data are available at Gene Expression Omnibus (http://www.ncbi.nlm.nih.gov/geo/query/acc.cgi?acc=GSE20916). (C) A representative data for GAD1 down-regulation glioblastoma (8). The expression profile is obtained from the Oncomine database. (http://www.ncbi.nlm.nih.gov/geo/query/acc.cgi?acc=GSE7696). Fig. S2 (A) Representative genomic bisulfite sequencing of genomic regions proximal to the GAD1 promoter in paired colon tumour vs. normal tissue (patient #C27). The diagram depicts the genomic organization of the human GAD1 locus proximal to the promoter. CpG islands are shown in green. The regions of bisulfite sequencing are shown in the red line under the CpG islands. Each circle in 5 the bisulfite sequencing data represents a CpG dinucleotide. Black circles, methylated cytosines; white circles, unmethylated cytosines.(B) GAD1 mRNA levels are consistent with the DNA methylation status. GAD1 expression was determined using real time RT-PCR analysis. Error bars indicate the standard deviation. Fig.S3 (A) Linear plots of quantitative real-time RT-PCR results for GAD1 expression in liver cancer cells. Case-matched samples are represented as independently connected normal (N) and tumour (T) point pairs. The relative expression of 1 represents an arbitrarily set value to encompass all variations. Each point is the average of at least 3 independent quantitative RT-PCR results. (B) The correlation of GAD1 expression and the extent of methylation in liver cancer. Tumour cases were classified into two categories, low methylation (MI<0.5) and high methylation (MI>0.5). GAD1 expression is equivalent to the mRNA fold change for paired tumour/normal samples. Each box represents the range of T/Nfold changes. The ends of the boxes represent the 25th and 75thpercentiles, the bars indicate the 10th and 90th percentiles, and theline represents the median. Significant differences were calculated using the Wilcoxonrank sum test. *, p<0.05. Fig. S4 Methylation status at the GAD1 locus and GAD1 mRNA levels in HUVECs and H1-hESC, HCT116, Hela-S3 and K562 cell lines from ENCODE data. The methylation status was determined by using Methyl 450K Bead Arrays from ENCODE/HAIB. Orange = methylated (score >= 600); purple = partially methylated (200 < score < 600); bright blue =unmethylated (0 < score <= 200). The transcription levels shown were assayed by high-throughput sequencing of polyadenylated RNA 6 (RNA-Seq). The signals are scaled and are present at each of the detected GAD1 exons. In each cell line, signals from two replicates are shown (http://genome.ucsc.edu/). Fig. S5 Demethylation by 5-aza-dC treatment decreases GAD1 transcription in colon and live cancer cells. The HCT116, SW480, and SMMC7721 and HUVEC cells were treated with 5-aza-dC for 72 h. (A) methylation status of CpG island 3b were determined by genomic bisulfite sequencing. Each circle in the bisulfite sequencing data represents a CpG dinucleotide. Black circles, methylated cytosines; white circles, unmethylated cytosines. (B) CDKN2A and CA4 mRNA levels were determined by quantitative RT-PCR. Error bars indicate standard deviations. (C) The diagram depicts the basic features of the GAD1 locus at the 5’ end, along with the approximate locations of the primer sets used to analyse the chromatin that immunoprecipitated with the H3K4me3 and H3K27me3 antibodies. The graph depicts the percentages of input chromatin recovered in the immunoprecipitation for each primer set. The data represent the mean of two independent replicates. Fig. S6 CTCF protein and mRNA levels in the HUVECs after transfection with shRNA-CTCF lentiviruses were detected by Western blot and quantitative RT-PCR. Fig. S7 Expression of GAD1 correlated well with mucinous colon cancer. Data were obtained from the TCGA database (http://tcga-data.nci.nih.gov/tcga/) and compiled by using Oncomine (www.oncomine.com). A total of 215 colorectal adenocarcinoma and 22 paired normal colorectal tissue samples were analysed. Fig. S8 GAD1 protein (A) and mRNA (B) levels in SW480 cells after transfection 7 with shRNA-GAD1 lentivirus were detected by Western blot and quantitative RT-PCR. Fig.S9 DNA methylation status at the GAD1 locus in 54 cancer or non-cancer cells. These data were captured in the UCSC genome browser from the methylation data determined by Methyl 450K Bead Arrays from ENCODE/HAIB. Orange = methylated (score >= 600), purple = partially methylated (200 < score < 600), bright blue = unmethylated (0 < score <= 200). The green rectangles indicate the CTCF binding sites (CTCF-BS2 and CTCF-BS3) located within CpG islands 3a (CGI-3a) and 5 (CGI-5). Fig.S10 DNA methylation status at the GAD1 locus in CNS or non-CNS cells. These data were captured in the UCSC genome browser from the methylation data determined by Methyl 450K Bead Arrays from ENCODE/HAIB and by Reduced Representation Bisulfite Seq from ENCODE/Hudson Alpha. For methyl 450k data, Orange = methylated (score >= 600), purple = partially methylated (200 < score < 600), bright blue = unmethylated (0 < score <= 200). For bisulfite seq data, red= 100% of molecules sequenced are methylated; yellow= 50% of molecules sequenced are methylated; green= 0% of molecules sequenced are methylated. NH-A: normal astrocytes; BC_Brain: brain, donor H11058N, age 66, Asian, normal; PFSK-1: neuroectodermal cell line derived from a cerebral brain tumor; SK-N-SH: neuroblastoma, cancer; BE2_C: a clone of the SK-N-BE neuroblastoma cell line (see ATCC CRL-2271), cancer. 8 References 1. Livak KJ, Schmittgen TD. Analysis of relative gene expression data using real-time quantitative PCR and the 2(-Delta Delta C(T)) Method. Methods. 2001 Dec;25(4):402-8. PubMed PMID: 11846609. 2. Herman JG, Graff JR, Myohanen S, Nelkin BD, Baylin SB. Methylation-specific PCR: a novel PCR assay for methylation status of CpG islands. Proceedings of the National Academy of Sciences of the United States of America. 1996 Sep 3;93(18):9821-6. PubMed PMID: 8790415. Pubmed Central PMCID: 38513. 3. Licchesi JD, Herman JG. Methylation-specific PCR. Methods in molecular biology. 2009;507:305-23. PubMed PMID: 18987823. 4. Dekker J, Rippe K, Dekker M, Kleckner N. Capturing chromosome conformation. Science. 2002 Feb 15;295(5558):1306-11. PubMed PMID: 11847345. 5. Fujita PA, Rhead B, Zweig AS, Hinrichs AS, Karolchik D, Cline MS, et al. The UCSC Genome Browser database: update 2011. Nucleic acids research. 2011 Jan;39(Database issue):D876-82. PubMed PMID: 20959295. Pubmed Central PMCID: 3242726. 6. Bao L, Zhou M, Cui Y. CTCFBSDB: a CTCF-binding site database for characterization of vertebrate genomic insulators. Nucleic acids research. 2008 Jan;36(Database issue):D83-7. PubMed PMID: 17981843. Pubmed Central PMCID: 2238977. 7. Rhodes DR, Yu J, Shanker K, Deshpande N, Varambally R, Ghosh D, et al. ONCOMINE: a cancer microarray database and integrated data-mining platform. Neoplasia. 2004 Jan-Feb;6(1):1-6. PubMed PMID: 15068665. Pubmed Central PMCID: 1635162. 8. Murat A, Migliavacca E, Gorlia T, Lambiv WL, Shay T, Hamou MF, et al. Stem cell-related 9 "self-renewal" signature and high epidermal growth factor receptor expression associated with resistance to concomitant chemoradiotherapy in glioblastoma. Journal of clinical oncology : official journal of the American Society of Clinical Oncology. 2008 Jun 20;26(18):3015-24. PubMed PMID: 18565887. 10
