NTI and the Sensitivity Analysis
advertisement
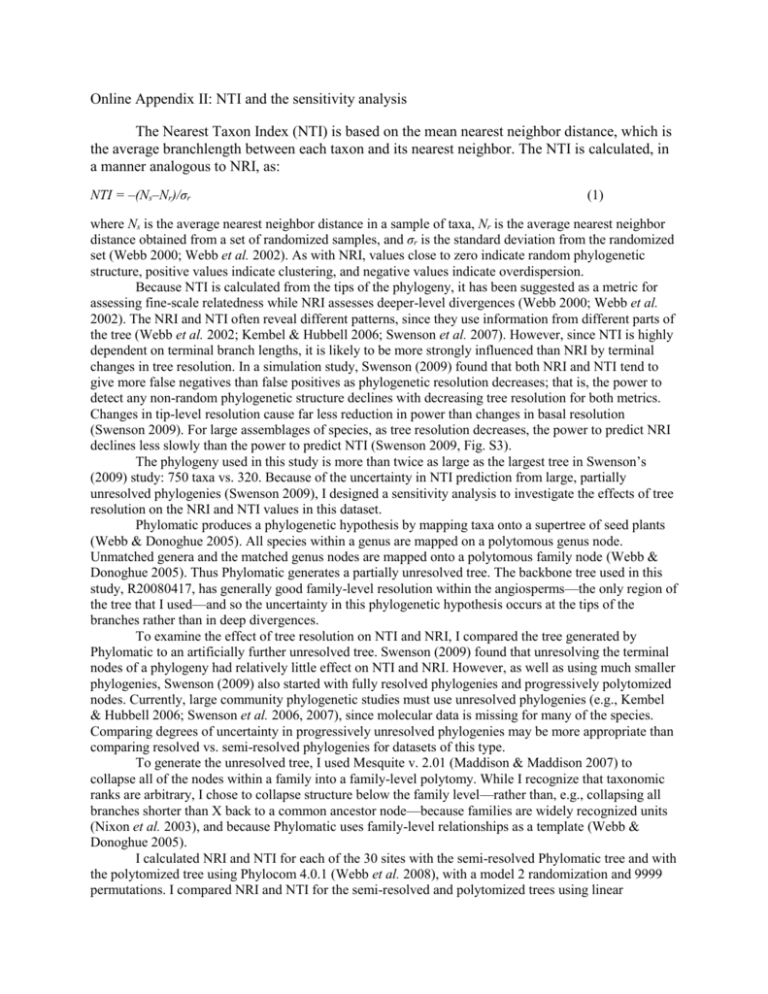
Online Appendix II: NTI and the sensitivity analysis The Nearest Taxon Index (NTI) is based on the mean nearest neighbor distance, which is the average branchlength between each taxon and its nearest neighbor. The NTI is calculated, in a manner analogous to NRI, as: NTI = –(Ns–Nr)/σr (1) where Ns is the average nearest neighbor distance in a sample of taxa, Nr is the average nearest neighbor distance obtained from a set of randomized samples, and σr is the standard deviation from the randomized set (Webb 2000; Webb et al. 2002). As with NRI, values close to zero indicate random phylogenetic structure, positive values indicate clustering, and negative values indicate overdispersion. Because NTI is calculated from the tips of the phylogeny, it has been suggested as a metric for assessing fine-scale relatedness while NRI assesses deeper-level divergences (Webb 2000; Webb et al. 2002). The NRI and NTI often reveal different patterns, since they use information from different parts of the tree (Webb et al. 2002; Kembel & Hubbell 2006; Swenson et al. 2007). However, since NTI is highly dependent on terminal branch lengths, it is likely to be more strongly influenced than NRI by terminal changes in tree resolution. In a simulation study, Swenson (2009) found that both NRI and NTI tend to give more false negatives than false positives as phylogenetic resolution decreases; that is, the power to detect any non-random phylogenetic structure declines with decreasing tree resolution for both metrics. Changes in tip-level resolution cause far less reduction in power than changes in basal resolution (Swenson 2009). For large assemblages of species, as tree resolution decreases, the power to predict NRI declines less slowly than the power to predict NTI (Swenson 2009, Fig. S3). The phylogeny used in this study is more than twice as large as the largest tree in Swenson’s (2009) study: 750 taxa vs. 320. Because of the uncertainty in NTI prediction from large, partially unresolved phylogenies (Swenson 2009), I designed a sensitivity analysis to investigate the effects of tree resolution on the NRI and NTI values in this dataset. Phylomatic produces a phylogenetic hypothesis by mapping taxa onto a supertree of seed plants (Webb & Donoghue 2005). All species within a genus are mapped on a polytomous genus node. Unmatched genera and the matched genus nodes are mapped onto a polytomous family node (Webb & Donoghue 2005). Thus Phylomatic generates a partially unresolved tree. The backbone tree used in this study, R20080417, has generally good family-level resolution within the angiosperms—the only region of the tree that I used—and so the uncertainty in this phylogenetic hypothesis occurs at the tips of the branches rather than in deep divergences. To examine the effect of tree resolution on NTI and NRI, I compared the tree generated by Phylomatic to an artificially further unresolved tree. Swenson (2009) found that unresolving the terminal nodes of a phylogeny had relatively little effect on NTI and NRI. However, as well as using much smaller phylogenies, Swenson (2009) also started with fully resolved phylogenies and progressively polytomized nodes. Currently, large community phylogenetic studies must use unresolved phylogenies (e.g., Kembel & Hubbell 2006; Swenson et al. 2006, 2007), since molecular data is missing for many of the species. Comparing degrees of uncertainty in progressively unresolved phylogenies may be more appropriate than comparing resolved vs. semi-resolved phylogenies for datasets of this type. To generate the unresolved tree, I used Mesquite v. 2.01 (Maddison & Maddison 2007) to collapse all of the nodes within a family into a family-level polytomy. While I recognize that taxonomic ranks are arbitrary, I chose to collapse structure below the family level—rather than, e.g., collapsing all branches shorter than X back to a common ancestor node—because families are widely recognized units (Nixon et al. 2003), and because Phylomatic uses family-level relationships as a template (Webb & Donoghue 2005). I calculated NRI and NTI for each of the 30 sites with the semi-resolved Phylomatic tree and with the polytomized tree using Phylocom 4.0.1 (Webb et al. 2008), with a model 2 randomization and 9999 permutations. I compared NRI and NTI for the semi-resolved and polytomized trees using linear Polytomized tree NTI NRI regression in the R Statistical Package (R Development Core Team 2008). The NRI values were minimally affected by terminal changes in tree resolution, while NTI values were much more sensitive (Fig. S1). 0.0 -0.5 -1.0 -1.5 -2.0 -2.5 -3.0 2 r = 0.99 1.0 0.5 0.0 -0.5 -1.0 -1.5 -2.0 2 r = 0.34 -3 -2 -1 0 Resolved tree 1 Fig. S1. Sensitivity of NRI and NTI to tree resolution. Because NTI is generated from tip-level relationships, which are generally the most uncertain in a large supertree, care should be taken when examining NTI values from a large dataset with a terminally unresolved phylogeny. In some studies (including this one), NTI seems to reveal less phylogenetic structure than NRI. Swenson et al. (2007) found that patterns of NRI at different spatial scales were much more comparable among five Neotropical forest plots than patterns of NTI. Kembel and Hubbell (2006), in subsamples of the Barro Colorado Island 50-ha plot, found more evidence of non-random phylogenetic structure when using NRI than NTI. While this pattern could easily have a biological basis—deep divergences may have a stronger effect on competitive interactions than tip-level divergences (Cahill et al. 2008)—the possibility that it is an artifact of the analytical method must be acknowledged. Literature cited: Cahill, J.F., Kembel, S.W., Lamb, E.G. & Keddy, P.A. 2008. Does phylogenetic relatedness influence the strength of competition among vascular plants? Persp. Plant Ecol. 10, 41–50. (doi:10.1016/j.ppees.2007.10.001) Kembel, S. W. & Hubbell, S. P. 2006 The phylogenetic structure of a neotropical forest tree community. Ecology 87, S86–S99. (doi: 10.1890/0012-9658(2006)87[86:TPSOAN]2.0.CO;2) Maddison, W. P. & D. R. Maddison. 2007 Mesquite: a modular system for evolutionary analysis. Version 2.01 http://mesquiteproject.org Nixon, K.J., Carpenter, J.M., & Stevenson, D.W. 2003 The PhyloCode is fatally flawed, and the “Linnaean” system can easily be fixed. Bot. Rev. 69, 111-120. (doi: 10.1663/00068101(2003)069[0111:TPIFFA]2.0.CO;2) R Development Core Team. 2008 R: a language and environment for statistical computing. R Foundation for Statistical Computing, Vienna, Austria. Version 2.7.2. http://www.R-project.org. Swenson, N. G., Enquist, B. J., Pither, J., Thompson, J. & Zimmerman, J. K. 2006 The problem and promise of scale dependence in community phylogenetics. Ecology 87, 2418–2424. (doi: 10.1890/0012-9658(2006)87[2418:TPAPOS]2.0.CO;2) Swenson, N.G., Enquist, B.J., Thompson, J., & Zimmerman, J.K. 2007. The influence of spatial and size scale on phylogenetic relatedness in tropical forest communities. Ecology 88, 1770-1780. (doi: 10.1890/06-1499.1) Swenson, N.G. 2009 Phylogenetic resolution and quantifying the phylogenetic diversity and dispersion of communities. PLOS One 4, e4390. (doi:10.1371/journal.pone.0004390) Webb, C. O. 2000. Exploring the phylogenetic structure of ecological communities: an example for rain forest trees. Am. Nat. 156, 145–155. (doi: 10.1086/303378) Webb, C. O., Ackerly, D. D., and Kembel, S. W. 2008. Phylocom: software for the analysis of phylogenetic community structure and character evolution. Bioinformatics 24, 2098-2100. Webb, C. O., Ackerly, D. D., McPeek, M. A. & Donoghue, M. J. 2002 Phylogenies and community ecology. Ann. Rev. Ecol. Syst. 33, 475–505. (doi:10.1146/annurev.ecolsys.33.010802.150448) Webb, C.O., & Donoghue, M. J. 2005. Phylomatic: tree assembly for applied phylogenetics. Molec. Ecol. Notes 5, 181-183.
