jec12491-sup-0001-Supinfo
advertisement
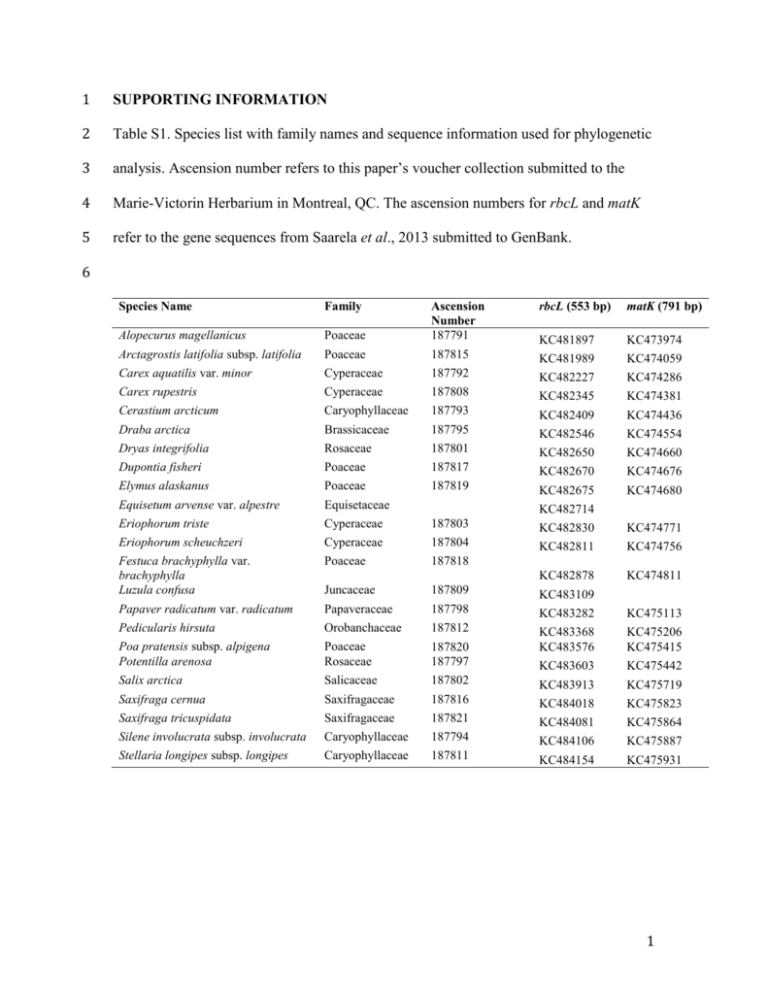
1 SUPPORTING INFORMATION 2 Table S1. Species list with family names and sequence information used for phylogenetic 3 analysis. Ascension number refers to this paper’s voucher collection submitted to the 4 Marie-Victorin Herbarium in Montreal, QC. The ascension numbers for rbcL and matK 5 refer to the gene sequences from Saarela et al., 2013 submitted to GenBank. 6 Species Name Family rbcL (553 bp) matK (791 bp) Poaceae Ascension Number 187791 Alopecurus magellanicus KC481897 KC473974 Arctagrostis latifolia subsp. latifolia Poaceae 187815 KC481989 KC474059 Carex aquatilis var. minor Cyperaceae 187792 KC482227 KC474286 Carex rupestris Cyperaceae 187808 KC482345 KC474381 Cerastium arcticum Caryophyllaceae 187793 KC482409 KC474436 Draba arctica Brassicaceae 187795 KC482546 KC474554 Dryas integrifolia Rosaceae 187801 KC482650 KC474660 Dupontia fisheri Poaceae 187817 KC482670 KC474676 Elymus alaskanus Poaceae 187819 KC482675 KC474680 Equisetum arvense var. alpestre Equisetaceae Eriophorum triste Cyperaceae 187803 KC482830 KC474771 Eriophorum scheuchzeri Cyperaceae 187804 KC482811 KC474756 Festuca brachyphylla var. brachyphylla Luzula confusa Poaceae 187818 KC482878 KC474811 Juncaceae 187809 KC483109 Papaver radicatum var. radicatum Papaveraceae 187798 KC483282 KC475113 Pedicularis hirsuta Orobanchaceae 187812 Poa pratensis subsp. alpigena Potentilla arenosa Poaceae Rosaceae 187820 187797 KC483368 KC483576 KC475206 KC475415 KC483603 KC475442 Salix arctica Salicaceae 187802 KC483913 KC475719 Saxifraga cernua Saxifragaceae 187816 KC484018 KC475823 Saxifraga tricuspidata Saxifragaceae 187821 KC484081 KC475864 Silene involucrata subsp. involucrata Caryophyllaceae 187794 KC484106 KC475887 Stellaria longipes subsp. longipes Caryophyllaceae 187811 KC484154 KC475931 KC482714 1 7 8 Figure S1. Digital Elevation Model (DEM) of site thermokarst. Darker tones show 9 subsided areas, with overall site elevation differences of 2m. White dots represent the 10 location of plots within transects that ran from west to east. The thermokarst zone is in 11 the center of the DEM and its borders coincide largely with the dark, heavily subsided 12 trough systems. Also noticeable within the thermokarst area are small “island” polygon 13 tops that rise above the subsidized troughs. 2 14 15 Figure S2. 500 MHz GPR transects collected at the site. This image is of five cross- 16 profile west-to-east transects collected at 25m apart throughout the site. Distance 0 m is 17 west and 200 m is east. Elevation refers to the corrected GPR profile incorporating dGPS 18 elevation points analyzed from our DEM. The surface of the GPR profile has been 19 corrected for topographical features such as polygon troughs and tops. Depth estimates of 20 features are based on a signal velocity of 0.065 m/ns. Dotted lines delimit the central 21 thermokarst area bordered by control areas on both sides. Within the thermokarst zone, a 22 strong signal is detected where moisture-saturated soils in the active layer are in contact 23 with frozen surfaces. Active layer signal is less strong in control areas due to drier soil 24 conditions. The breaks in data are due to standing water in which the GPR cannot 25 operate. 26 3 27 28 Figure S3. Values of Moran’s I range from -1 (strong negative spatial autocorrelation) to 29 +1 (strong spatial autocorrelation). Values around zero signify spatially independent data. 30 The filled points indicate values of Moran’s I (p < 0.05) that are significantly 31 autocorrelated. The circle line is vegetation abundance and shows a clear spatial pattern 32 across the site, with significant spatial autocorrelation in most distance classes. The 33 triangle line is the residuals from a linear regression of abundance explained by H2O % 34 content of soil. Here, we show that once soil moisture is taken into account the spatial 35 pattern of vegetation abundance disappears. 36 4 37 Table S2. PERMANOVA results testing difference in community structure of different 38 microhabitats. Thermokarst communities are significantly distinct from control 39 communities (called “location”), however tops do not differ significantly from troughs 40 (called “type”). The significant interaction of location and type likely indicates a differing 41 response in community composition change depending on whether thermokarst occurs to 42 a polygon top or trough. 43 Term location type location:type Residuals Total Df 1 1 1 71 74 Sum Of Sqs 3.95 0.4045 0.5835 15.5844 20.5224 MeanSqs 3.95 0.4045 0.5835 0.2195 F 17.9958 1.8426 2.6583 r2 0.19248 0.01971 0.02843 0.75939 1 P 0.001 0.072 0.021 44 45 5 46 47 48 Figure S4. Two common metrics used to quantify phylogenetic dispersion of species 49 assemblages. Both measures are used to see whether the phylogenetic diversity of a 50 community is greater or less than expected given a community’s species composition. 51 Both relatedness calculations here are weighted by abundance of each species. NRI (a) 52 examines whether the species in a plot are more closely related than chance, whereas NTI 53 (b) focuses on whether the most closely related co-occurring species is more or less 54 closely related than chance. Negative NRI and NTI values indicate higher than expected 55 phylogenetic diversity (overdispersion), whereas positive NRI and NTI values indicate 56 less than expected phylogenetic diversity (clustering). NRI and NTI values less than 57 ±1.96 are non-significant as they fail to pass α < 0.05. The majority of our data points do 58 not meet this criterion, and we therefore see a lack of significant 59 overdispersion/clustering in either NRI or NTI. We also see no significant differences 60 between any of the microtopographies. 6 61 62 Figure S5. Averaged phylogenetic trees of the four microtopography types, weighted by 63 abundance. For each microtopography, the plots’ vegetation abundances were averaged 64 together to generate the red circles (i.e. greater abundance equals larger circles). The 65 species names listed are those that are present in any abundance at a given 66 microtopography. Absence of a species indicates that it was not found in any plots from 67 that microtopography. 7
