Atlantic Canada Math Curriculum Outcomes
advertisement

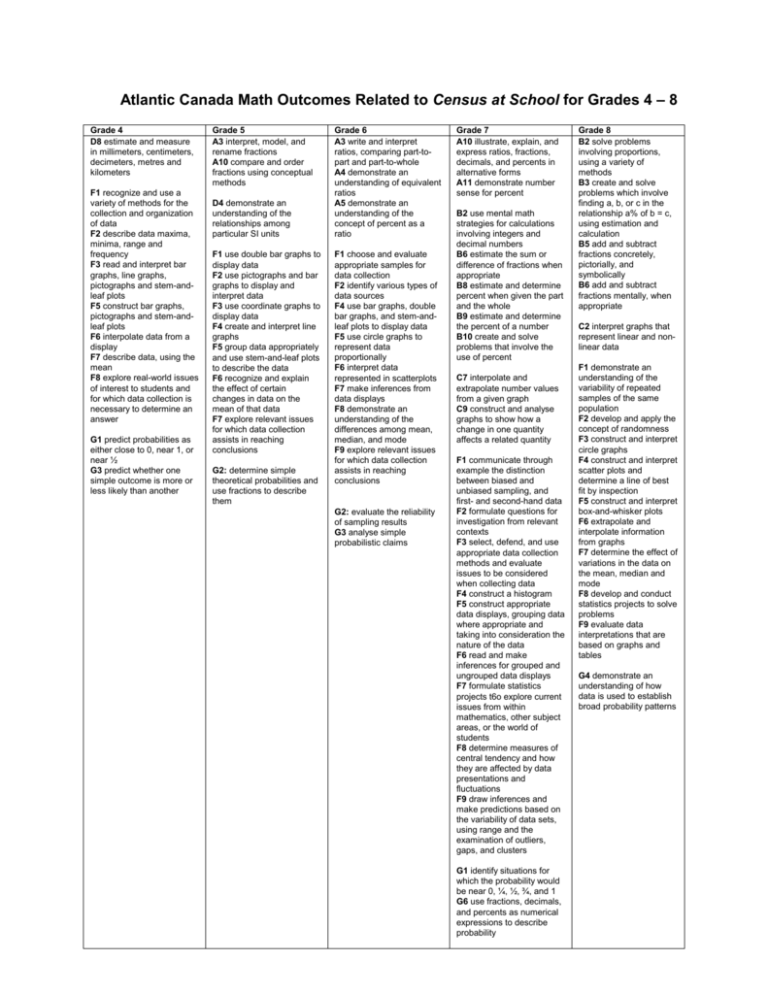
Atlantic Canada Math Outcomes Related to Census at School for Grades 4 – 8 Grade 4 D8 estimate and measure in millimeters, centimeters, decimeters, metres and kilometers F1 recognize and use a variety of methods for the collection and organization of data F2 describe data maxima, minima, range and frequency F3 read and interpret bar graphs, line graphs, pictographs and stem-andleaf plots F5 construct bar graphs, pictographs and stem-andleaf plots F6 interpolate data from a display F7 describe data, using the mean F8 explore real-world issues of interest to students and for which data collection is necessary to determine an answer G1 predict probabilities as either close to 0, near 1, or near ½ G3 predict whether one simple outcome is more or less likely than another Grade 5 A3 interpret, model, and rename fractions A10 compare and order fractions using conceptual methods D4 demonstrate an understanding of the relationships among particular SI units F1 use double bar graphs to display data F2 use pictographs and bar graphs to display and interpret data F3 use coordinate graphs to display data F4 create and interpret line graphs F5 group data appropriately and use stem-and-leaf plots to describe the data F6 recognize and explain the effect of certain changes in data on the mean of that data F7 explore relevant issues for which data collection assists in reaching conclusions G2: determine simple theoretical probabilities and use fractions to describe them Grade 6 A3 write and interpret ratios, comparing part-topart and part-to-whole A4 demonstrate an understanding of equivalent ratios A5 demonstrate an understanding of the concept of percent as a ratio F1 choose and evaluate appropriate samples for data collection F2 identify various types of data sources F4 use bar graphs, double bar graphs, and stem-andleaf plots to display data F5 use circle graphs to represent data proportionally F6 interpret data represented in scatterplots F7 make inferences from data displays F8 demonstrate an understanding of the differences among mean, median, and mode F9 explore relevant issues for which data collection assists in reaching conclusions G2: evaluate the reliability of sampling results G3 analyse simple probabilistic claims Grade 7 A10 illustrate, explain, and express ratios, fractions, decimals, and percents in alternative forms A11 demonstrate number sense for percent B2 use mental math strategies for calculations involving integers and decimal numbers B6 estimate the sum or difference of fractions when appropriate B8 estimate and determine percent when given the part and the whole B9 estimate and determine the percent of a number B10 create and solve problems that involve the use of percent C7 interpolate and extrapolate number values from a given graph C9 construct and analyse graphs to show how a change in one quantity affects a related quantity F1 communicate through example the distinction between biased and unbiased sampling, and first- and second-hand data F2 formulate questions for investigation from relevant contexts F3 select, defend, and use appropriate data collection methods and evaluate issues to be considered when collecting data F4 construct a histogram F5 construct appropriate data displays, grouping data where appropriate and taking into consideration the nature of the data F6 read and make inferences for grouped and ungrouped data displays F7 formulate statistics projects t6o explore current issues from within mathematics, other subject areas, or the world of students F8 determine measures of central tendency and how they are affected by data presentations and fluctuations F9 draw inferences and make predictions based on the variability of data sets, using range and the examination of outliers, gaps, and clusters G1 identify situations for which the probability would be near 0, ¼, ½, ¾, and 1 G6 use fractions, decimals, and percents as numerical expressions to describe probability Grade 8 B2 solve problems involving proportions, using a variety of methods B3 create and solve problems which involve finding a, b, or c in the relationship a% of b = c, using estimation and calculation B5 add and subtract fractions concretely, pictorially, and symbolically B6 add and subtract fractions mentally, when appropriate C2 interpret graphs that represent linear and nonlinear data F1 demonstrate an understanding of the variability of repeated samples of the same population F2 develop and apply the concept of randomness F3 construct and interpret circle graphs F4 construct and interpret scatter plots and determine a line of best fit by inspection F5 construct and interpret box-and-whisker plots F6 extrapolate and interpolate information from graphs F7 determine the effect of variations in the data on the mean, median and mode F8 develop and conduct statistics projects to solve problems F9 evaluate data interpretations that are based on graphs and tables G4 demonstrate an understanding of how data is used to establish broad probability patterns Atlantic Canada Outcomes Related to Census at School Activities Grades 9 - 11 Grade 9 F1 describe characteristics of possible relationships shown in scatter-plots F2 sketch lines of best fit and determine their equations F3 sketch curves of best fit that appear to be non-linear F4 select, defend, and use the most appropriate methods for displaying data F5 draw inferences and make predictions based on data analysis and data displays F6 demonstrate an understanding of the role of data management in society F7 evaluate arguments and interpretations that are based on data analysis G3 demonstrate an understanding of how experimental and theoretical probabilities are related G4 recognize and explain why decisions based on probabilities may be combinations of theoretical calculations, experimental results, and subjective judgments Grade 10 A2 analyse graphs or charts given of situations to identify specific information A7 demonstrate an understanding of and apply the proper use of discrete and continuous number systems C1 express problems in terms of equations and vice versa C2 model real-world phenomena with linear, quadratic, exponential, and power equations and linear inequalities C3 gather data, plot the data using appropriate scales, and demonstrate an understanding of independent and dependent variables and of domain and range C4 create and analyse scatter plots using appropriate technology C5 sketch graphs from words, tables, and collected data C8 identify, generalize, and apply patterns C9 construct and analyse graphs and tables relating two variables C10 describe real-world relationships depicted by graphs, tables of values, and written descriptions C14 determine the equation of a line using the slope and y-intercept C15 develop and apply strategies for solving problems C17 solve problems using graphing technology C28 explore and describe the dynamics of change depicted in tables and graphs C32 determine if a graph is linear by plotting points in a given situation F1 design and conduct experiments using statistical methods and scientific inquiry F2 demonstrate an understanding of concerns and issues that pertain to the collection of data F3 construct various displays of data F4 calculate various statistics, using appropriate technology, analyse and interpret displays, and describe the relationships F5 analyse statistical summaries, draw conclusions, and communicate results about distributions of data F6 solve problems by modeling real-world phenomena F8 determine and apply a line of best fit, using the least squares method and median-median method, with and without technology, and describe the differences between the two methods F9 demonstrate an intuitive understanding of correlation F10 use interpolation, extrapolation, and equations to predict and solve problems F11 describe real-world relationships depicted by graphs and tables of values and written descriptions F13 calculate and apply mean and standard deviation, using technology, to determine if a variation makes a difference F14 make and interpret frequency bar graphs while conducting experiments and exploring measurement issues Grade 11 A3 demonstrate an understanding of the application of random numbers to statistical sampling F1 draw inferences about a population from a sample F2 identify bias in a collection, interpretation, and presentation F4 demonstrate an understanding of the differences in the quality of sampling F7 draw inferences from graphs, tables, and reports F8 apply characteristics of normal distributions F9 demonstrate an understanding of the difference between sample standard population deviation and population standard deviation F10 interpret and apply histograms F11 determine, interpret, and apply confidence intervals F15 design and conduct surveys and/or simulate data collection to explore sampling variability F 16 demonstrate an understanding of the difference between situations involving binomial experiments and those which do not FX distinguish between descriptive and inferential statistics FX2 demonstrate an understanding of the differences in the quality of sampling methods FY demonstrate an understanding of how the confidence levels affects the confidence interval FY2 demonstrate an understanding of the role of the central limit theorem in the development of confidence intervals FY3 distinguish between the calculation of confidence intervals for a known population mean versus an unknown population mean FY4 distinguish between the calculation of confidence intervals for a known population proportion versus an unknown population proportion FY5 identify the characteristics of a binomial experiment G3 graph and interpret sample distributions of the sample mean and sample distributions of the sample proportion Prepared by Anna Spanik, Halifax Regional School Board


