Edexcel Foundation Paper 2
advertisement
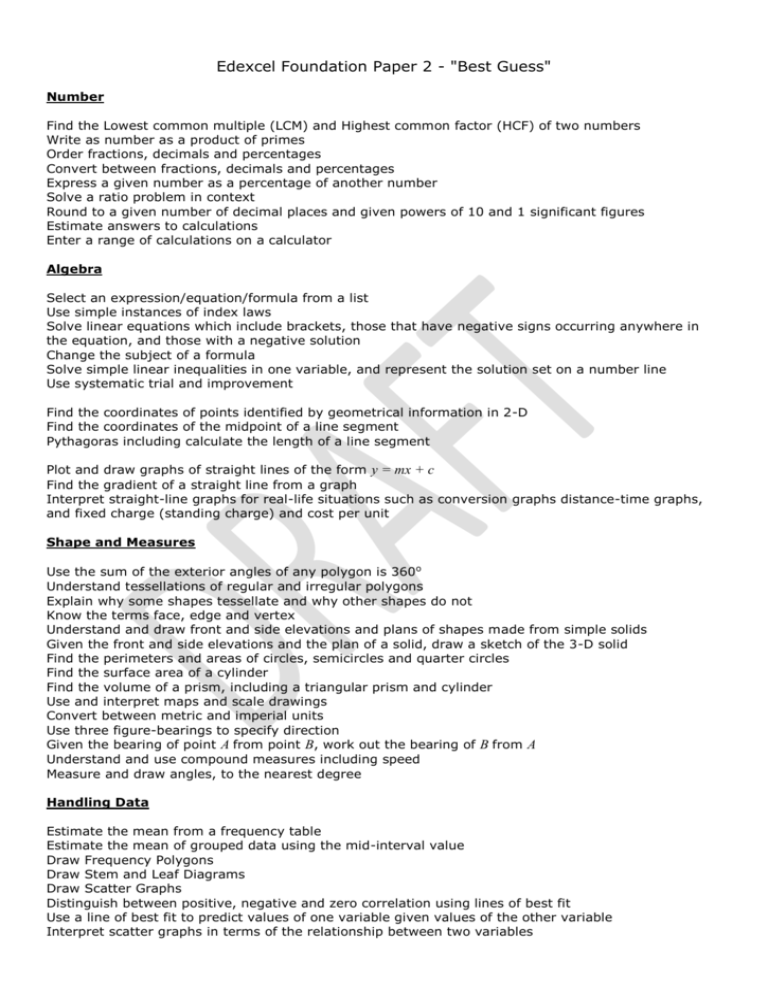
Edexcel Foundation Paper 2 - "Best Guess" Number Find the Lowest common multiple (LCM) and Highest common factor (HCF) of two numbers Write as number as a product of primes Order fractions, decimals and percentages Convert between fractions, decimals and percentages Express a given number as a percentage of another number Solve a ratio problem in context Round to a given number of decimal places and given powers of 10 and 1 significant figures Estimate answers to calculations Enter a range of calculations on a calculator Algebra Select an expression/equation/formula from a list Use simple instances of index laws Solve linear equations which include brackets, those that have negative signs occurring anywhere in the equation, and those with a negative solution Change the subject of a formula Solve simple linear inequalities in one variable, and represent the solution set on a number line Use systematic trial and improvement Find the coordinates of points identified by geometrical information in 2-D Find the coordinates of the midpoint of a line segment Pythagoras including calculate the length of a line segment Plot and draw graphs of straight lines of the form y = mx + c Find the gradient of a straight line from a graph Interpret straight-line graphs for real-life situations such as conversion graphs distance-time graphs, and fixed charge (standing charge) and cost per unit Shape and Measures Use the sum of the exterior angles of any polygon is 360o Understand tessellations of regular and irregular polygons Explain why some shapes tessellate and why other shapes do not Know the terms face, edge and vertex Understand and draw front and side elevations and plans of shapes made from simple solids Given the front and side elevations and the plan of a solid, draw a sketch of the 3-D solid Find the perimeters and areas of circles, semicircles and quarter circles Find the surface area of a cylinder Find the volume of a prism, including a triangular prism and cylinder Use and interpret maps and scale drawings Convert between metric and imperial units Use three figure-bearings to specify direction Given the bearing of point A from point B, work out the bearing of B from A Understand and use compound measures including speed Measure and draw angles, to the nearest degree Handling Data Estimate the mean from a frequency table Estimate the mean of grouped data using the mid-interval value Draw Frequency Polygons Draw Stem and Leaf Diagrams Draw Scatter Graphs Distinguish between positive, negative and zero correlation using lines of best fit Use a line of best fit to predict values of one variable given values of the other variable Interpret scatter graphs in terms of the relationship between two variables Understand that correlation does not imply causality Probability Find the probability of an event happening using relative frequency Estimate the number of times an event will occur, given the probability and number of trials List all outcomes for two successive events systematically Use and draw sample space diagrams Identify different mutually exclusive outcomes and know that the sum of the probabilities of all these outcomes is 1 Use 1 − p as the probability of an event not occurring where p is the probability of it occurring Find a missing probability from a list or table Compare relative frequencies from samples of different sizes


