Graphing Rules
advertisement
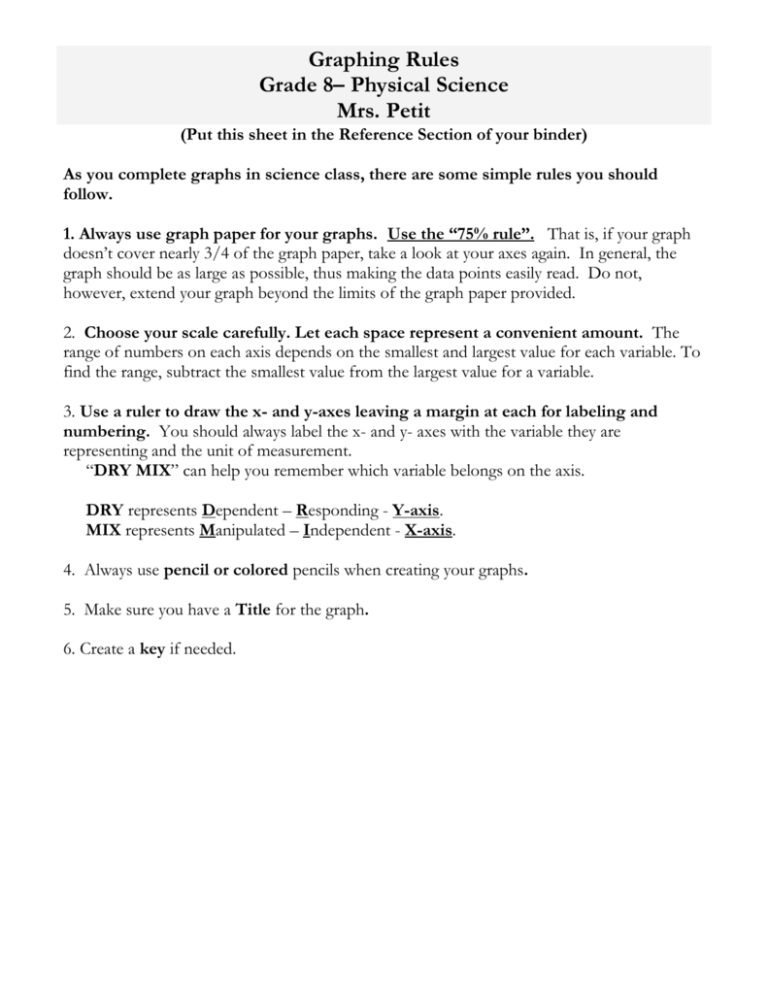
Graphing Rules Grade 8– Physical Science Mrs. Petit (Put this sheet in the Reference Section of your binder) As you complete graphs in science class, there are some simple rules you should follow. 1. Always use graph paper for your graphs. Use the “75% rule”. That is, if your graph doesn’t cover nearly 3/4 of the graph paper, take a look at your axes again. In general, the graph should be as large as possible, thus making the data points easily read. Do not, however, extend your graph beyond the limits of the graph paper provided. 2. Choose your scale carefully. Let each space represent a convenient amount. The range of numbers on each axis depends on the smallest and largest value for each variable. To find the range, subtract the smallest value from the largest value for a variable. 3. Use a ruler to draw the x- and y-axes leaving a margin at each for labeling and numbering. You should always label the x- and y- axes with the variable they are representing and the unit of measurement. “DRY MIX” can help you remember which variable belongs on the axis. DRY represents Dependent – Responding - Y-axis. MIX represents Manipulated – Independent - X-axis. 4. Always use pencil or colored pencils when creating your graphs. 5. Make sure you have a Title for the graph. 6. Create a key if needed. GRAPHING PRACTICE Grade 8 ~ Physical Science II. Practice using the graphing rules above and create the following graphs. GRAPH #1 a. Jamie bought a new video game and decided to keep track of his scores over a period of one week. Day 1 – 150 pts Day 3 – 200 pts Day 5 – 265 pts Day 2 – 375 pts Day 4 – 420 pts Day 6 – 485 pts Create a bar graph of Jamie’s progress. Put the “Days” on the X axis and the “Points Scored” on the y axis. 1. What is the independent variable? _____________________________________________________ 2. What is the dependent variable? ______________________________________________________ Using complete sentences state a conclusion about the data in graph # 1. _________________________________________________________________________________________________ _________________________________________________________________________________________________ _________________________________________________________________________________________________ GRAPH # 2 Directions: Graph the following data tables using the appropriate type of graph. Be sure to: provide a title, a label for the x & y axis, a key (if necessary), and an appropriate number scale. 1. The data table shows water temperatures at various depths in an ocean. Water Depth (meters) Temperature (°C) 50 18 75 15 100 12 150 5 200 4 Using the information in the data table, construct a line graph on the grid, following the directions below: -- Plot the data on the grid. Surround each point with a small circle and connect the points. Example: Problems Based on Graphing of Water Temperatures 1. Using complete sentences, state the general relationship between temperature and water depth. Example: As the water depth increases/decreases, the temperature increases/decreases. _________________________________________________________________________________________________ _________________________________________________________________________________________________ 2. The approximate water temperature at a depth of 125 meters would be closest to: _____________ (a) 15°C (b) 8°C (c) 13°C (d) 3°C GRAPH # 3 Display the data in a multiple line graph. How Much Beef and Chicken Do Americans Eat Each Year? (Pounds per person) Year 1989 1990 1991 1992 1993 1994 1995 * Source: U.S. Department of Agriculture Beef 65 64 63 63 62 64 62 Chicken 41 42 44 46 49 50 52 1. What is the independent variable? _____________________________________________________ 2. What is the dependent variable? ______________________________________________________ Using complete sentences state a conclusion about the data in graph # 3. _________________________________________________________________________________________________ _________________________________________________________________________________________________ _________________________________________________________________________________________________

