Exploring Polar Equations
advertisement

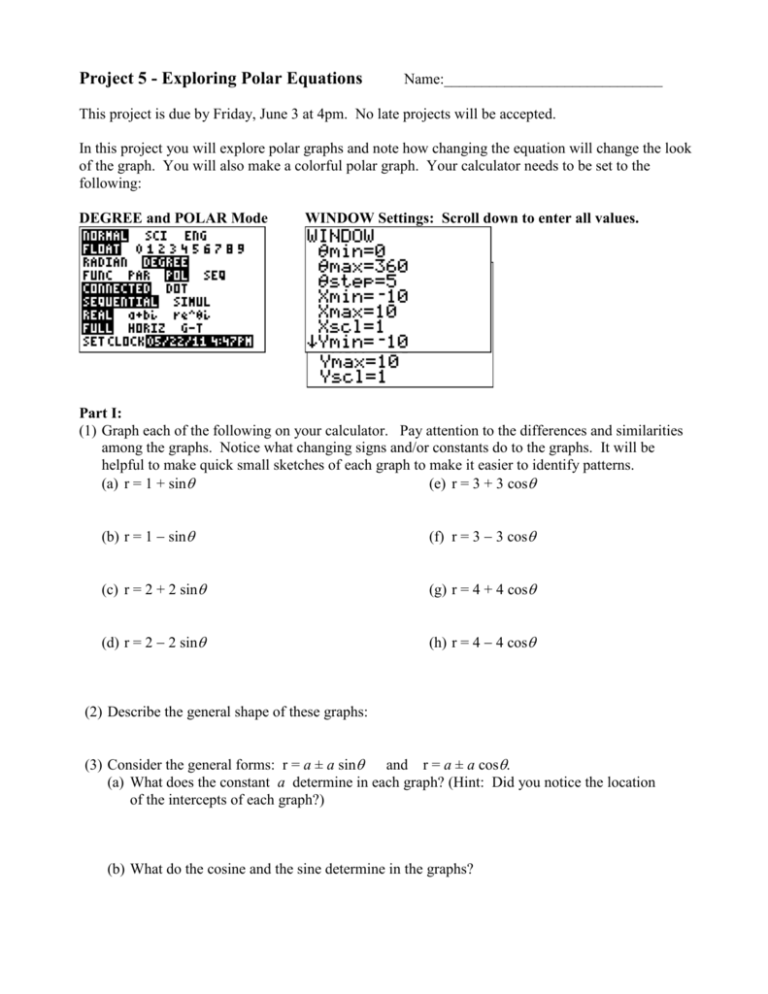
Project 5 - Exploring Polar Equations Name:_____________________________ This project is due by Friday, June 3 at 4pm. No late projects will be accepted. In this project you will explore polar graphs and note how changing the equation will change the look of the graph. You will also make a colorful polar graph. Your calculator needs to be set to the following: DEGREE and POLAR Mode WINDOW Settings: Scroll down to enter all values. Part I: (1) Graph each of the following on your calculator. Pay attention to the differences and similarities among the graphs. Notice what changing signs and/or constants do to the graphs. It will be helpful to make quick small sketches of each graph to make it easier to identify patterns. (a) r = 1 + sin (e) r = 3 + 3 cos (b) r = 1 sin (f) r = 3 3 cos (c) r = 2 + 2 sin (g) r = 4 + 4 cos (d) r = 2 2 sin (h) r = 4 4 cos (2) Describe the general shape of these graphs: (3) Consider the general forms: r = a ± a sin and r = a ± a cos. (a) What does the constant a determine in each graph? (Hint: Did you notice the location of the intercepts of each graph?) (b) What do the cosine and the sine determine in the graphs? Part II: (1) Graph each of the following on your calculator. Pay attention to the differences and similarities among the graphs, especially to the sizes of the loops. It will be helpful to make quick small sketches of each graph to make it easier to identify patterns. (a) r = 1 + 3sin (e) r = 1 + 4cos (b) r = 3 + 5sin (f) r = 2 + 3cos (c) r = 2 5sin (g) r = 1 5cos (d) r = 3 5sin (h) r = 4 5cos (2) Describe the general shape of these graphs: (3) Consider the general forms: r = a ± b sin and r = a ± b cos. (a) What does a + b determine in the graph? (b) What does b a determine in the graph? Part III: (1) Graph each of the following on your calculator. Pay attention to the differences and similarities among the graphs. It will be helpful to make quick small sketches of each graph to make it easier to identify patterns. (a) r = 3cos(2 ) (d) r = 5cos(4 ) (b) r = 4cos(2 ) (e) r = 5cos(5 ) (c) r = 4cos(3 ) (f) r = 6cos(6 ) (2) Describe the general shape of these graphs: (3) Consider the general forms: r = a cos (b ). (a) What does the constant a determine in the graph? (b) How is b related to the number of petals if b is even? What about if b is odd? Part IV: Use the table feature of your calculator to help you generate the points you need for the following graphs. You will graph each of the 3 graphs on the SAME polar paper. Color as indicated. You can borrow colored pencils at the information counter in the Learning Center. Input your equation, go to 2nd TBLSET (see the screenshot), and then go to 2nd TABLE. GRAPH 1: Fill in the table, plot each point, connect with a smooth curve, and fill in area GREEN. r = 10cos(4) 10 0 15 30 45 60 75 90 105 120 135 150 165 180 195 210 225 240 255 270 285 300 315 330 345 360 GRAPH 1: Fill in the table, plot each point, connect with a smooth curve, and fill in area BLUE OR RED. r = 9sin(2) 0 0 15 30 45 60 75 90 105 120 135 150 165 180 195 210 225 240 255 270 285 300 315 330 345 360 GRAPH 3: Fill in the table, plot each point, and connect with a smooth YELLOW curve. r = 10 10 0 15 30 45 60 75 90 105 120 135 150 165 180 195 210 225 240 255 270 285 300 315 330 345 360


