Prof - Userpage
advertisement
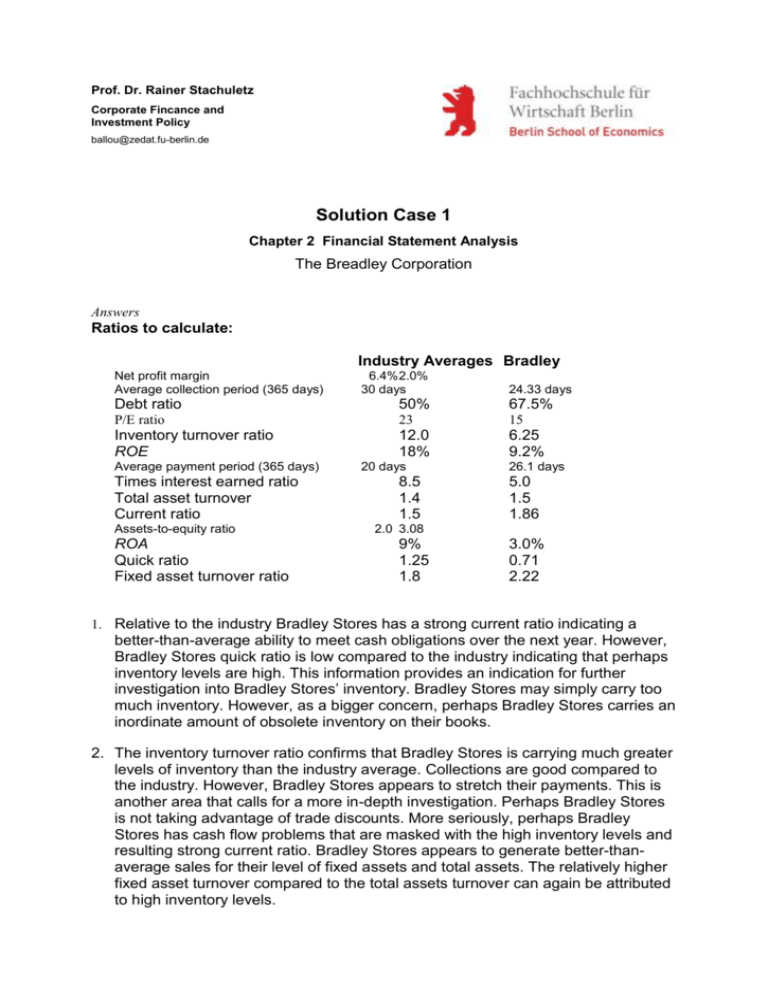
Prof. Dr. Rainer Stachuletz Corporate Fincance and Investment Policy ballou@zedat.fu-berlin.de Solution Case 1 Chapter 2 Financial Statement Analysis The Breadley Corporation Answers Ratios to calculate: Industry Averages Bradley Net profit margin Average collection period (365 days) 6.4% 2.0% 30 days 24.33 days Debt ratio 50% 67.5% P/E ratio 23 15 Inventory turnover ratio ROE 12.0 18% 6.25 9.2% Average payment period (365 days) Times interest earned ratio Total asset turnover Current ratio Assets-to-equity ratio ROA Quick ratio Fixed asset turnover ratio 20 days 8.5 1.4 1.5 26.1 days 5.0 1.5 1.86 2.0 3.08 9% 1.25 1.8 3.0% 0.71 2.22 1. Relative to the industry Bradley Stores has a strong current ratio indicating a better-than-average ability to meet cash obligations over the next year. However, Bradley Stores quick ratio is low compared to the industry indicating that perhaps inventory levels are high. This information provides an indication for further investigation into Bradley Stores’ inventory. Bradley Stores may simply carry too much inventory. However, as a bigger concern, perhaps Bradley Stores carries an inordinate amount of obsolete inventory on their books. 2. The inventory turnover ratio confirms that Bradley Stores is carrying much greater levels of inventory than the industry average. Collections are good compared to the industry. However, Bradley Stores appears to stretch their payments. This is another area that calls for a more in-depth investigation. Perhaps Bradley Stores is not taking advantage of trade discounts. More seriously, perhaps Bradley Stores has cash flow problems that are masked with the high inventory levels and resulting strong current ratio. Bradley Stores appears to generate better-thanaverage sales for their level of fixed assets and total assets. The relatively higher fixed asset turnover compared to the total assets turnover can again be attributed to high inventory levels. 3. Bradley Stores has greater debt levels than the industry on average, indicating greater financial risk. Compounding this concern is a low times-interest-earned ratio. Bradley Stores buffer in covering their interest costs is less than the industry. This is another area that needs further investigation. Could Bradley Stores raise their sales price on certain items? Alternatively, does Bradley Stores need to better control costs? 4. Profitability is low compared to the industry. These ratios highlight that Bradley Stores needs to either increase revenues or reduce costs. A DuPont Analysis provides additional insight. Industry Bradley Stores NPM TAT A/E = ROE 6.4% 1.4 2.0 = 18.0% NPM TAT A/E = ROE 2.0% 1.5 3.08 = 9.0% As seen in the DuPont Analysis, Bradley Stores’ ROE is much lower due to a low net profit margin. This highlights the concern of revenues and costs. It is also important to point out that Bradley Stores has a low ROE despite having a high equity multiplier (asset to equity ratio). A greater equity multiplier indicates greater financial risk, where all else being equal, we would expect a higher ROE to compensate for this greater risk. 5. The PE ratio shows that investors value Bradley Stores at a lower multiple than they do other firms in the industry. It appears that market participants have also uncovered these operational problems associated with Bradley Stores. 6. The concerns with Bradley Stores include high inventory levels, slow payments to vendors, high debt levels, low interest coverage, and low profit margins. Further investigation is necessary, but based on this analysis Bradley Stores does not appear to be in a strong borrowing position.
