18 · Acid-Base Reactions
advertisement
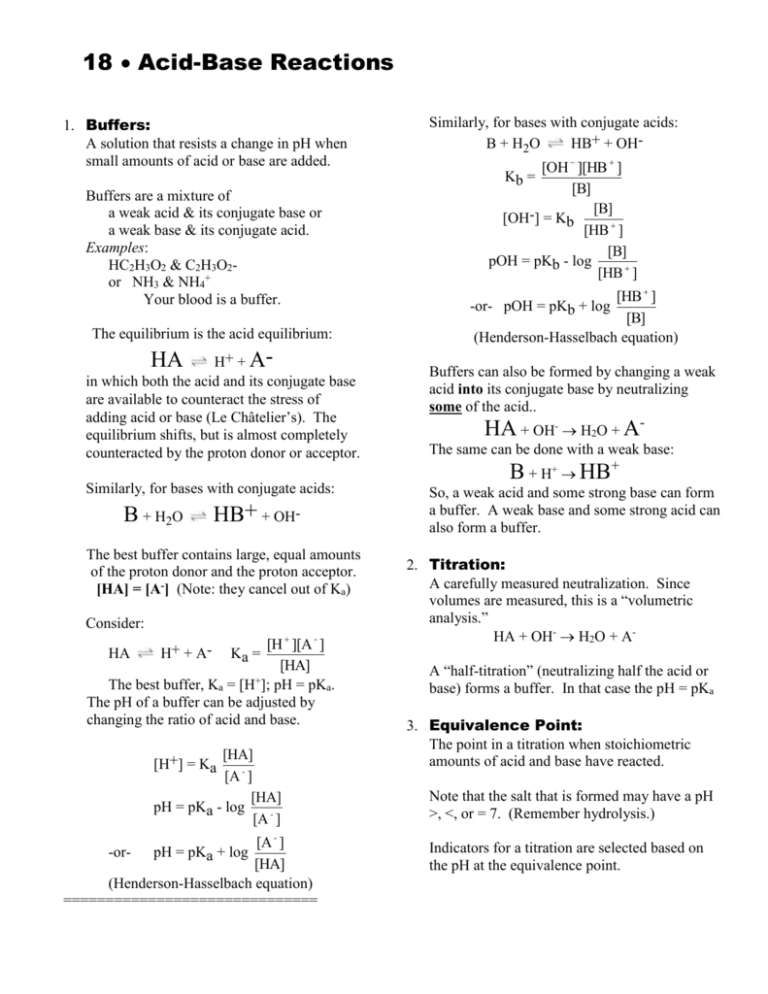
18 Acid-Base Reactions 1. Buffers: A solution that resists a change in pH when small amounts of acid or base are added. Buffers are a mixture of a weak acid & its conjugate base or a weak base & its conjugate acid. Examples: HC2H3O2 & C2H3O2or NH3 & NH4+ Your blood is a buffer. The equilibrium is the acid equilibrium: H+ + Ain which both the acid and its conjugate base are available to counteract the stress of adding acid or base (Le Châtelier’s). The equilibrium shifts, but is almost completely counteracted by the proton donor or acceptor. HA Similarly, for bases with conjugate acids: B + H2O HB+ + OH- The best buffer contains large, equal amounts of the proton donor and the proton acceptor. [HA] = [A-] (Note: they cancel out of Ka) Consider: [H ][A - ] [HA] + The best buffer, Ka = [H ]; pH = pKa. The pH of a buffer can be adjusted by changing the ratio of acid and base. HA H+ + A- Ka = [HA] [H+] = Ka [A - ] [HA] pH = pKa - log [A - ] [A - ] [HA] (Henderson-Hasselbach equation) ============================== -or- pH = pKa + log Similarly, for bases with conjugate acids: B + H2O HB+ + OH- [OH ][HB ] Kb = [B] [B] [OH-] = Kb [HB ] [B] pOH = pKb - log [HB ] [HB ] [B] (Henderson-Hasselbach equation) -or- pOH = pKb + log Buffers can also be formed by changing a weak acid into its conjugate base by neutralizing some of the acid.. HA + OH- H2O + AThe same can be done with a weak base: B + H+ HB+ So, a weak acid and some strong base can form a buffer. A weak base and some strong acid can also form a buffer. 2. Titration: A carefully measured neutralization. Since volumes are measured, this is a “volumetric analysis.” HA + OH- H2O + AA “half-titration” (neutralizing half the acid or base) forms a buffer. In that case the pH = pKa 3. Equivalence Point: The point in a titration when stoichiometric amounts of acid and base have reacted. Note that the salt that is formed may have a pH >, <, or = 7. (Remember hydrolysis.) Indicators for a titration are selected based on the pH at the equivalence point. 4. Titration Curves: This graph shows how the pH changes as a titration occurs. (A) Weak acid/Strong Base HA + OHA- + H2O NOTE: Graph should have “pH” as the vertical axis and “added base” as the horizontal axis. The graph should be in an “S” shape. The middle of the lower part of the “S” indicates the point of maximum buffering where [HA]/[A-] = 1. The middle of the “S” is the equivalence point (above pH = 7) and [HA] = 0. The top part of the “S” levels off at the pH of the base solution. (B) Weak base/Strong acid B + H3O+ BH+ + H2O NOTE: Graph should have “pH” as the vertical axis and “added acid” as the horizontal axis. The graph should be in a “backwards S” shape. The middle of the upper part of the “backwards S” indicates the point of maximum buffering where [B]/[HB+] = 1. The middle of the “backwards S” is the equivalence point (below pH = 7) and [B] = 0. The bottom part of the “backwards S” levels off at the pH of the acid solution. (C) Weak diprotic acid/Strong base H2A + OHHA- + H2O HA- + OHA2- + H O 2 NOTE: Graph should have “pH” as the vertical axis and “added base” as the horizontal axis. The graph should be in a “double S” shape. The middle of the lower part of the “first S” indicates the point of maximum buffering of the first buffering zone where [H2A]/[HA-] = 1. The middle of the “first S” is the first equivalence point where [H2A] = 0. The top part of the “first S” (i.e. the lower part of the “second S”) indicates the point of maximum buffering of the second buffering zone where [HA-]/[A2-] = 1. The middle of the “second S” is the second equivalence point where [HA-] = 0. The top part of the “second S” levels off at the pH of the base solution.
